Randomized Controlled Trial
. 2008 Jun 15;177(12):1384-90.
doi: 10.1164/rccm.200711-1675OC. Epub 2008 Mar 27.

The affective dimension of laboratory dyspnea: air hunger is more unpleasant than work/effort

Affiliations
Randomized Controlled Trial

The affective dimension of laboratory dyspnea: air hunger is more unpleasant than work/effort

Robert B Banzett et al. Am J Respir Crit Care Med. .

Abstract

Rationale: It is hypothesized that the affective dimension of dyspnea (unpleasantness, emotional response) is not strictly dependent on the intensity of dyspnea.

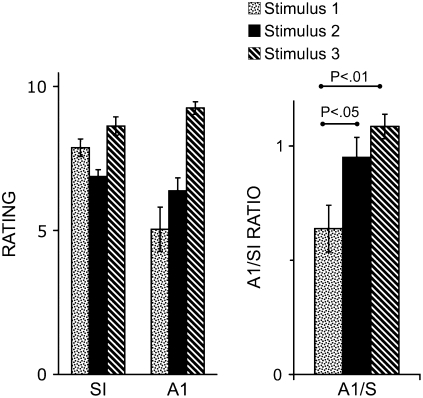
Objectives: We tested the hypothesis that the ratio of immediate unpleasantness (A(1)) to sensory intensity (SI) varies depending on the type of dyspnea.

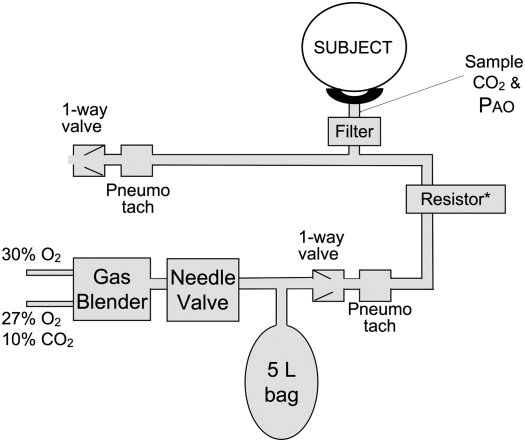
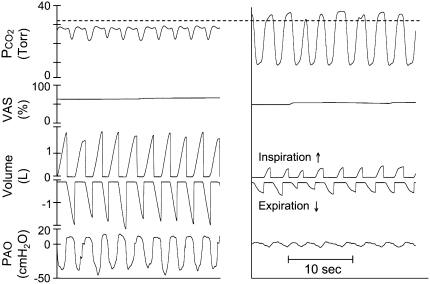
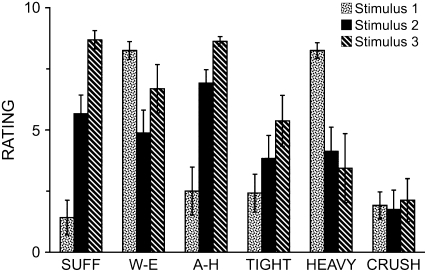
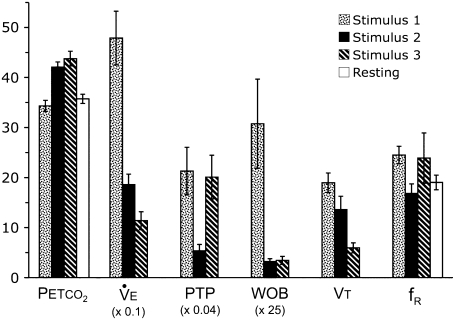
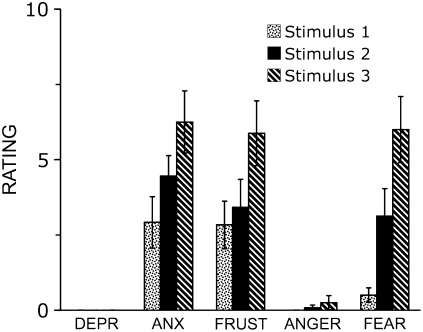
Methods: Twelve healthy subjects experienced three stimuli: stimulus 1: maximal eucapnic voluntary hyperpnea against inspiratory resistance, requiring 15 times the work of resting breathing; stimulus 2: Pet(CO(2)) 6.1 mm Hg above resting with ventilation restricted to less than spontaneous breathing; stimulus 3: Pet(CO(2)) 7.7 mm Hg above resting with ventilation further restricted. After each trial, subjects rated SI, A(1), and qualities of dyspnea on the Multidimensional Dyspnea Profile (MDP), a comprehensive instrument tested here for the first time.

Measurements and main results: Stimulus 1 was always limited by subjects failing to meet a higher ventilation target; none signaled severe discomfort. This evoked work and effort sensations, with relatively low unpleasantness (mean A(1)/SI = 0.64). Stimulus 2, titrated to produce dyspnea ratings similar to those subjects gave during stimulus 1, evoked air hunger and produced significantly greater unpleasantness (mean A(1)/SI = 0.95). Stimulus 3, increased until air hunger was intolerable, evoked the highest intensity and unpleasantness ratings and high unpleasantness ratio (mean A(1)/SI = 1.09). When asked which they would prefer to repeat, all subjects chose stimulus 1.

Conclusions: (1) Maximal respiratory work is less unpleasant than moderately intense air hunger in this brief test; (2) unpleasantness of dyspnea can vary independently from perceived intensity, consistent with the prevailing model of pain; (3) separate dimensions of dyspnea can be measured with the MDP.


Figures

<b>Figure 1.</b>
Figure 1.
Breathing circuit. During stimulus administration, subjects breathed via a tight-fitting facemask connected to a non-rebreathing valve system via a viral filter/rehumidifier (Airlife HEPA; Cardinal Health, McGaw Park, IL). Inspired gas was supplied from a 5-L rubber anesthesia bag; expired gas exited to the room. The subject's minute ventilation was set by the flow rate of gas into the bag (see stimulus descriptions in text). *During stimulus 1, an inspiratory resistance was imposed (14 cm H2O at 1.0 L · s−1). The resistor was not present during stimuli 2 and 3. We controlled gas flow to the bag and CO2 concentration to meet the needs of each stimulus.
<b>Figure 2.</b>
Figure 2.
Time traces of physiological data and online ratings (visual analog scale [VAS]) during rating focus periods for stimulus 1 (left) and stimulus 2 (right). Data are from subject BN28. Pao = pressure measured in the mask. Horizontal dashed line represents resting PetCO2 in this subject. Breaths 3, 4, and 6 in the right panel are examples of inadequate end-tidal samples that were dropped from analysis. Volume = separate inspiratory and expiratory volumes obtained by integrating flow from the two pneumotachometers, reset for each breath.
<b>Figure 3.</b>
Figure 3.
Ratings of qualities of respiratory sensation (mean ± SE) during the rating focus periods for stimulus 1, normocapnic hyperpnea with inspiratory resistance; stimulus 2, hypercapnia with moderate restriction of ventilation; stimulus 3, hypercapnia with severe restriction of ventilation. SUFF = “I am smothering, suffocating”; W-E = “My breathing requires work or effort”; A-H = “I cannot get enough air. I feel hunger for air”; TIGHT = “My chest and lungs feel tight, constricted”; HEAVY = “I am breathing a lot; breathing rapidly, deeply or heavily”; CRUSH = “I feel a crushing, heavy sensation in my chest”. Scale maximum definition: “As intense as I can imagine”. Eight of the 12 subjects completed stimulus 3; all completed stimuli 1 and 2.
<b>Figure 4.</b>
Figure 4.
Physiological variables during rating focus periods plus the preceding 20 seconds, as well as PetCO2 and fR during resting breathing without mask. Values shown are the mean and SE for all subjects. Rates are normalized to 1 minute. Extensive variables (V̇e, WOB, Vt) were normalized to body weight. Several variables were multiplied by a scaling factor for the figure; factor is noted for each. fR = breathing frequency (breaths · min−1); PetCO2 = end-tidal Pco2 (mm Hg); PTP = pressure time product (cm H2O · s · min−1; scaling factor, 0.04); V̇e = minute ventilation (ml · min−1 · kg−1; scaling factor, 0.1); Vt = expiratory tidal volume (ml · kg−1); WOB = external work of breathing (joules · min−1 · kg−1; scaling factor, 25). PetCO2 for each time point was calculated based on published air hunger response dynamics (22).
<b>Figure 5.</b>
Figure 5.
Sensory intensity (SI) and immediate unpleasantness (A1) of each stimulus (mean ± SE; left panel). A 10 on the SI scale was defined as “maximum”; 10 on the A1 scale was defined as “unbearable.” The relative unpleasantness (A1/SI) ratios (right panel) were significantly greater for those stimuli evoking predominantly air hunger (stimuli 2 and 3). Although 4 of the 12 subjects were not tested with stimulus 3, A1/SI for the 8 subjects tested was not significantly different from the group of 12 for the other stimuli (0.53 for stimulus 1 and 0.91 for stimulus 2).
<b>Figure 6.</b>
Figure 6.
Ratings of A2 (emotional/evaluative response: depression [DEPR], anxiety [ANX], frustration [FRUST], anger, and fear; 10 defined as “Most severe I can imagine”; mean ± SE).

References

    1. American Thoracic Society. Dyspnea: mechanisms, assessment, and management: a consensus statement. Am J Respir Crit Care Med 1999;159:321–340. - PubMed
    1. International Association for the Study of Pain Task Force on Taxonomy. Classification of chronic pain. In: Merskey H, Bogduk N, editors. Classification of chronic pain, 2nd ed. Seattle, WA: IASP Press; 1994. p. 210.
    1. Dudgeon DJ. Managing dyspnea and cough. Hematol Oncol Clin North Am 2002;16:557–577. - PubMed
    1. Price DD. Psychological and neural mechanisms of the affective dimension of pain. Science 2000;288:1769–1772. - PubMed
    1. Price DD, Harkins SW. The affective-motivational dimension of pain: a two-stage model. APS Journal 1992;1:229–239.

Publication types