. 2008 Mar 21;4(3):e1000021.
doi: 10.1371/journal.pcbi.1000021.

Uncovering a macrophage transcriptional program by integrating evidence from motif scanning and expression dynamics

Affiliations

Uncovering a macrophage transcriptional program by integrating evidence from motif scanning and expression dynamics

Stephen A Ramsey et al. PLoS Comput Biol. .

Erratum in

  • PLoS Comput Biol. 2008 Mar;4(3). doi: 10.1371/annotation/1c55be5f-ecd7-49be-91c1-91881be60297
  • PLoS Comput Biol. 2008 Mar;4(3). doi: 10.1371/annotation/e14ad837-e5ff-4bd5-a5f2-f32e784d75a2

Abstract

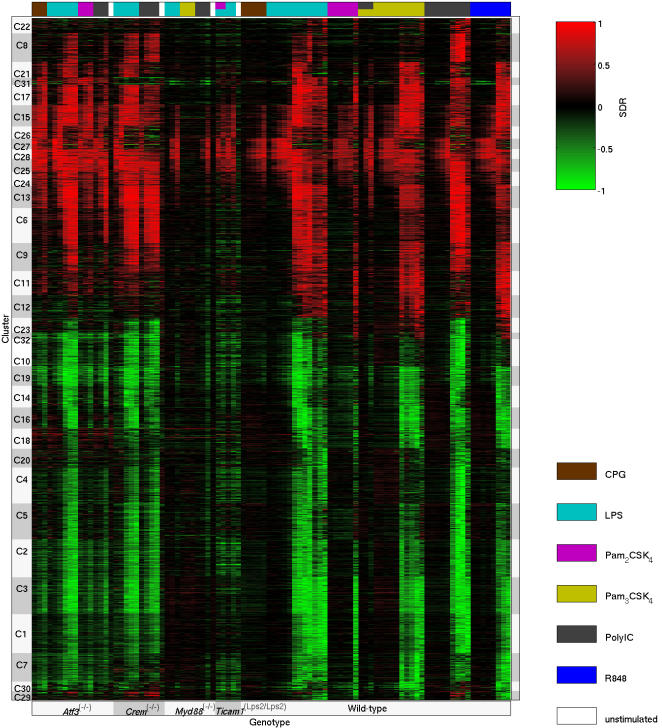
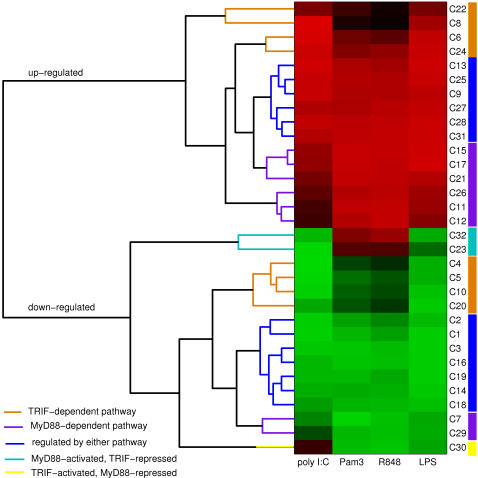
Macrophages are versatile immune cells that can detect a variety of pathogen-associated molecular patterns through their Toll-like receptors (TLRs). In response to microbial challenge, the TLR-stimulated macrophage undergoes an activation program controlled by a dynamically inducible transcriptional regulatory network. Mapping a complex mammalian transcriptional network poses significant challenges and requires the integration of multiple experimental data types. In this work, we inferred a transcriptional network underlying TLR-stimulated murine macrophage activation. Microarray-based expression profiling and transcription factor binding site motif scanning were used to infer a network of associations between transcription factor genes and clusters of co-expressed target genes. The time-lagged correlation was used to analyze temporal expression data in order to identify potential causal influences in the network. A novel statistical test was developed to assess the significance of the time-lagged correlation. Several associations in the resulting inferred network were validated using targeted ChIP-on-chip experiments. The network incorporates known regulators and gives insight into the transcriptional control of macrophage activation. Our analysis identified a novel regulator (TGIF1) that may have a role in macrophage activation.


Conflict of interest statement

The authors have declared that no competing interests exist.

Figures

Figure 1
Figure 1. Global heat-map of differential gene expression in TLR-stimulated murine macrophages, organized by clusters of co-expressed genes.
Each row is one of the 1,960 genes that are differentially expressed in macrophages under TLR stimulation, and each column is a replicate-combined microarray experiment. Red/green coloring indicates the differential expression level (SDR-normalized, see Equation 1). Red indicates upregulation relative to wild-type unstimulated macrophages. Green indicates downregulation relative to wild-type unstimulated macrophages. Genotypes are indicated along the bottom edge. Clusters are indicated along the left edge. Stimuli are indicated along the top edge, with the color scheme given in the lower right corner. Clusters have been ordered based on pairwise similarity, as described in Materials and Methods, Expression Clustering.
Figure 2
Figure 2. Hierarchical organization of differentially expressed gene clusters from TLR-stimulated macrophages reveals pathway-specific transcriptional responses.
The color of a rectangle in the heat-map shows the cluster-median differential expression (relative to wild-type unstimulated macrophages) under stimulation with the TLR agonist indicated by the column label (bottom of figure), for the cluster indicated by the row label (right-hand side). The column label Pam3 denotes the TLR agonist Pam3CSK4. The differential gene expression level is computed using the signed difference ratio (SDR, see Equation 1). Clusters (rows) have been ordered for display based on similarity of overall transcriptional response to the four indicated TLR agonists (see Materials and Methods, Expression Clustering). In the heat-map, green indicates downregulation, and red indicates upregulation. Colored subtrees of the dendrogram indicate specific inferences that can be made about the likely signaling pathway (MyD88-dependent, TRIF-dependent, or a combination) on which the transcriptional regulation of the cluster depends. The legend in the lower-left corner explains the color scheme for denoting the inferred signaling pathway-dependence of the clusters. Clusters without a color bar on the right appear to respond through either signaling pathway. The regulation of clusters C7, C11, C12, C15, C17, C21, C26, and C29 appears to be primarily MyD88-dependent; regulation of clusters C4, C5, C6, C8, C10, C20, C22, and C24 appears to be primarily TRIF-dependent; and clusters C23, C30, and C32 appear to be regulated oppositely by the two signaling pathways. This plot shows only the extremal differential response to TLR agonists; the clusters also differ in temporal expression (see Figure S3, Figure S4, Figure S5, and Figure S6).
Figure 3
Figure 3. Early induced gene clusters are enriched for transcription factors.
Each circular data point indicates a cluster. The horizontal axis is the estimated time scale for the differential expression level of the genes within the cluster to reach 25% of the maximum absolute differential expression (the “response time”). The response time was computed under LPS stimulation of wild-type macrophages (see Materials and Methods, Expression Clustering). The horizontal dashed line indicates the average fraction of genes that are known transcription factors, among all annotated genes in the mouse genome (0.053, see Materials and Methods, Selection of Transcription Factors). The slope of the best-fit line to the scatter plot is −3.84 (Pearson's R = −0.74).
Figure 4
Figure 4. Two validated transcriptional regulatory interactions exhibiting high time-lagged correlations.
(A) Rel and Nfkb1. The solid line shows the expression of Rel (c-REL), and the dotted line shows the expression of Nfkb1 (p50/p105) in LPS-stimulated wild-type macrophages, over eight hours. The genes exhibit a high time-lagged correlation with a time delay of 60 minutes (across the eleven time-course experiments listed in Table S9, ρτ = 0.91 and P = 0.011; see Materials and Methods, Time-lagged Correlation, for an explanation of the statistical test). The NFκB heterodimers c-REL-p50 and c-REL-p65 are known to regulate expression of Nfkb1 . The correlation at zero time lag is 0.81. (B) Irf7 and Stat1. The solid line shows the expression of Irf7 (IRF7) and the dotted line shows the expression of Stat1 (STAT1) in LPS-stimulated Atf3 (−/−) macrophages. The genes exhibit a high time-lagged correlation with a time delay of 20 minutes (across the ten experiments, ρτ = 0.96 and P = 0.002). The transcription factor IRF7 has been shown to regulate the Stat1 gene expression in the innate immune response to viral infection . The correlation at zero time lag is 0.95. (C) Time-lagged correlation coefficient and time-lagged correlation significance measure formula image 
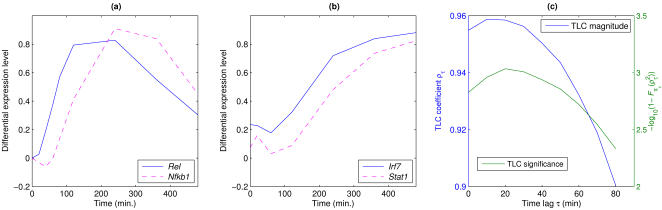
(see Equation 4) as a function of the time lag τ, for Irf7 and Stat1. The peak value of ρτ 2 occurs at τ = 10, but the peak significance value (taking into account the lag-specific null distribution) occurs at τ = 20 min.
Figure 5
Figure 5. Patterns of high-confidence motif enrichments within promoters of target clusters reveal associations between regulatory elements and expression patterns.
Each row in the matrix represents a TF binding element, and each column represents a cluster of differentially expressed genes. Clusters are ordered as in Figure 2, and thus are grouped hierarchically by similarity of their extremal expression fold-change under the four TLR agonists LPS, Pam3CSK4, poly I:C, and R848. Each motif (row) is associated with one or more position-weight matrices (the V$ prefix and numeric suffixes are omitted, and results for multiple position-weight matrices representing the same motif were combined for each column, by taking the matrix with the maximum number of matches within the indicated cluster). Each colored block in the matrix indicates pair of a motif and target cluster for which the fraction of genes in the cluster with a motif match, is enriched relative to the overall fraction of genes expressed in the macrophage that possess the motif (P≤10−2, Fisher's exact test). The color of each matrix element (block) in the interior of the figure indicates the fraction scanned of genes within the cluster containing at least one match for the indicated motif. The number of scanned genes within the cluster that contained a match for the indicated motif is shown in yellow typeface. The red/green colored blocks above the top horizontal axis shows whether each cluster is upregulated (red) or downregulated (green) at its most extremal fold-change under stimulation with the aforementioned TLR agonists. The hatched green/red pattern indicates a cluster whose extremal fold-change direction (up/down) is stimulus-dependent (see Figure 2). The colored (blue, cyan, orange, yellow, purple) blocks above the top of the matrix indicate the likely pathway through which the cluster is differentially expressed; the color scheme corresponds to that shown in the dendrogram in Figure 2.
Figure 6
Figure 6. Transcription factor genes associated with clusters in the inferred transcriptional network.
(A) The matrix shows associations between transcription factor genes and co-expressed gene clusters. Each column represents one of the 27 clusters within the inferred network, and each row represents one of the 36 transcription factor genes in the network. Clusters are ordered based on the LPS response time, defined as the time (under LPS stimulation) at which the cluster-median differential expression level reaches 25% of the maximum differential expression (see Materials and Methods, Expression Clustering). Transcription factor genes are ordered based on the LPS response time. The vertical gray line separates upregulated clusters (left half) from downregulated clusters (right half). The horizontal gray line separates upregulated transcription factors (top) from downregulated transcription factors (bottom). An orange or blue square indicates a statistically significant association between the transcription factor gene and the cluster, based on both promoter scanning and expression dynamics. An orange solid rectangle represents a positive average time-lagged correlation with genes in the cluster; a blue solid rectangle represents a negative average time-lagged correlation. (B) The red-green matrix is a heat-map showing transcription factor gene expression. The color indicates the normalized differential expression of the indicated transcription factor gene (over time), in LPS-stimulated wild-type macrophages (SDR, see Equation 1). Red indicates upregulation relative to unstimulated macrophages and green indicates downregulation. A diamond symbol indicates the transcription factor response time. (C) Each column of the red-green matrix indicates the median normalized differential expression of the genes in the indicated cluster (over time), in LPS-stimulated wild-type macrophages. The diamond indicates the average LPS response time of the genes within the cluster.

References

    1. Underhill DM, Ozinsky A. Toll-like receptors: key mediators of microbe detection. Curr Opin Immunol. 2002;14:103–110. - PubMed
    1. Takeda K, Kaisho T, Akira S. Toll-like receptors. Annu Rev Immunol. 2003;21:335–376. - PubMed
    1. Hoebe K, Du X, Georgel P, Janssen E, Tabeta K, et al. Identification of Lps2 as a key transducer of MyD88-independent TIR signalling. Nature. 2003;424:743–748. - PubMed
    1. Yamamoto M, Sato S, Hemmi H, Hoshino K, Kaisho T, et al. Role of adaptor TRIF in the MyD88-independent toll-like receptor signaling pathway. Science. 2003;301:640–643. - PubMed
    1. Adachi O, Kawai T, Takeda K, Matsumoto M, Tsutsui H, et al. Targeted disruption of the MyD88 gene results in loss of IL-1 and IL-18-mediated function. Immunity. 1998;9:143–150. - PubMed

Publication types