. 2008 Mar 28;4(3):e1000042.
doi: 10.1371/journal.pcbi.1000042.

Shaping embodied neural networks for adaptive goal-directed behavior

Affiliations

Shaping embodied neural networks for adaptive goal-directed behavior

Zenas C Chao et al. PLoS Comput Biol. .

Abstract

The acts of learning and memory are thought to emerge from the modifications of synaptic connections between neurons, as guided by sensory feedback during behavior. However, much is unknown about how such synaptic processes can sculpt and are sculpted by neuronal population dynamics and an interaction with the environment. Here, we embodied a simulated network, inspired by dissociated cortical neuronal cultures, with an artificial animal (an animat) through a sensory-motor loop consisting of structured stimuli, detailed activity metrics incorporating spatial information, and an adaptive training algorithm that takes advantage of spike timing dependent plasticity. By using our design, we demonstrated that the network was capable of learning associations between multiple sensory inputs and motor outputs, and the animat was able to adapt to a new sensory mapping to restore its goal behavior: move toward and stay within a user-defined area. We further showed that successful learning required proper selections of stimuli to encode sensory inputs and a variety of training stimuli with adaptive selection contingent on the animat's behavior. We also found that an individual network had the flexibility to achieve different multi-task goals, and the same goal behavior could be exhibited with different sets of network synaptic strengths. While lacking the characteristic layered structure of in vivo cortical tissue, the biologically inspired simulated networks could tune their activity in behaviorally relevant manners, demonstrating that leaky integrate-and-fire neural networks have an innate ability to process information. This closed-loop hybrid system is a useful tool to study the network properties intermediating synaptic plasticity and behavioral adaptation. The training algorithm provides a stepping stone towards designing future control systems, whether with artificial neural networks or biological animats themselves.


Conflict of interest statement

The authors have declared that no competing interests exist.

Figures

Figure 1
Figure 1. Closed-loop algorithm.
(A) Closed-loop design: the sensory mapping (1–2), the motor mapping (3–4), and the training rules (5–6). Refer to Methods for a detailed explanation. (B) Motor mapping transformation. Left: In the beginning of each experiment, each CPS (CPSQ1–CPSQ4) was continuously delivered every 5 seconds with RBS in between. After the animat reached the outer circle, it was moved back to the inner circle. Middle: The average CAs from probe responses to each CPS were calculated (CAQ1–CAQ4). The average CAs represent the average movements from each CPS. Right: The transformation formula image 
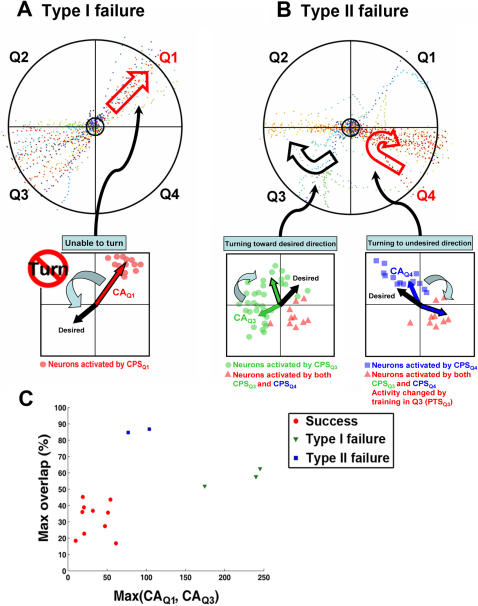
for each CPS was created so that the average movement in each quadrant would be the desired movement with a magnitude of 1 unit (MQ1–MQ4).
Figure 2
Figure 2. RBS stabilized the network input-output function.
(A) An example of the time course of the distance between the animat and the origin. The animat stayed within the desired area (the inner circle of 5 units radius) for more than 95% of an hour when RBS was applied. When no RBS was applied, the animat moved outward after 10 minutes. When the animat reached the outer circle of 50 units radius, it was put back to a random location within the inner circle, which is shown as vertical downward lines. (B) The mutual information between the movement angle and the sensory input. When no RBS was applied, the mutual information decreased significantly when the animat started moving outward. (C) Comparison between the mutual information during the last 10 minutes (light gray, P2 period shown in [B]) and that during the first 10 minutes (dark gray, P1) for the 15 simulations (3 networks, 5 different selections of CPSs each). With RBS, the mutual information in P2 was comparable to that in P1 (p = 0.77). Without RBS, the mutual information in P2 was significantly lower than that in P1 (p<1e-4, shown as an asterisk).
Figure 3
Figure 3. Adaptation to a new sensory mapping.
The animat's learning ability was quantified by its ability to restore desired behavior after a sensory mapping switch. (A) An example of successful learning. The distance between the animat and the origin is shown in the left panel. The animat maintained the desired behavior for the first 10 minutes (the average inward movement in each quadrant during this 10-min duration is shown on the top), before the sensory mapping switch was performed between quadrants Q1 and Q3 at 10 minutes into the simulation. Immediately after the switch, the animat started moving outward (the trajectory is shown in the right panel). The red arrows on the top indicate the average outward movements in Q1 and Q3 during a 5-min time bin after the switch. Eventually, the animat adapted to the switch and restored the desired behavior to stay within the inner circle under the new sensory mapping. The average movements in all quadrants became toward the center again during the last 10 minutes, where the restored desired movements in Q1 and Q3 are highlighted in green. Ten simulations (out of 15) showed successful adaptation to the switch. (B) An example of unsuccessful learning. The animat kept moving outward and was repeatedly returned to the inner circle after reaching the outer circle. The training was unable to restore the desired behavior throughout 4 hours of experiment. Only the first 90 minutes are shown for clarity. One-third of the simulations showed unsuccessful learning.
Figure 4
Figure 4. All successful and unsuccessful learning simulations.
The distances between the animat and the origin in all 15 simulations are shown. The animat maintained the desired behavior before the sensory mapping switch (red triangle) between quadrants Q1 and Q3 at 10 minutes into the simulation (green bar). Immediately after the switch, the animat started moving outward. In 10 simulations, the animat adapted to the switch and restored the desired behavior to stay within the inner circle under the new sensory mapping (orange bar). For the other 5 with unsuccessful learning, the animat kept moving outward and was repeatedly returned to the inner circle after reaching the outer circle. The training was unable to restore the desired behavior throughout 4 hours of experiment (only the first 3 hours are shown for clarity). Type I and Type II failures are indicated (see Results).
Figure 5
Figure 5. Hypotheses about the reasons for unsuccessful learning.
One-third of the experiments showed unsuccessful learning. Two types of learning failures were found, and examples are shown. (A) Type I failure: the animat showed no sign of improving behavior in the quadrant(s) where the switch of the sensory mapping was performed (Q1 and/or Q3). Using the trajectory in Q1 as an example, the animat kept going outward without turning (indicated as a hollow red arrow). In those cases, CPSQ1 and/or CPSQ3 evoked activity in neurons localized mainly at one quadrant of the network. The localization of neurons activated by CPSQ1 is illustrated in the cartoon. We hypothesize that this localization reduced or eliminated the ability of the responses to shift the CA from the original direction (shown as a solid red arrow) toward the desired direction (shown as a black arrow). (B) Type II failure: the animat showed signs of improving by changing movement direction(s) in the quadrant(s) where the switch was performed (Q1 and/or Q3). However, the original desired movement direction(s) in the un-switched quadrant(s) (Q2 and/or Q4) was/were changed into undesired ones(s). Using the trajectory in Q3 and Q4 as an example, the animat was able to turn in Q3 (shown as a hollow black arrow) but the desired direction in Q4 was later altered (shown as a hollow red arrow). In those cases, neurons activated by different CPSs had large degrees of overlap. The neurons activated both by CPSQ3, CPSQ4, and both are illustrated in the cartoon. We hypothesize that the training stimuli in Q3 caused correlated changes in the overlapped neurons (shown as red dots), which caused undesired change in responses to CPSQ4. (C) The degree of overlap (quantified by Max overlap, see Methods) is plotted versus the degree of localization (quantified by Max(CAQ1, CAQ3)), which shows that smaller overlap, smaller CAQ1 and smaller CAQ3 were found in all 10 successful cases. Also, Type I failure showed large Max(CAQ1, CAQ3) and Type II failure showed large Max overlap.
Figure 6
Figure 6. Improved learning by selecting CPSs based on the hypotheses.
Successful adaptations can be achieved by selecting CPSs with small Max(CAQ1, CAQ3) and small Max overlap. (A) Max(CAQ1, CAQ3) and Max overlap from 100 randomly-selected sets of CPSs in the three simulated networks. The 15 sets of CPSs used in the previous simulations are indicated as dots and crosses with black outlines. Among the 100 sets, 64 sets satisfied the criteria of Max(CAQ1, CAQ3)<150 and Max overlap<50% (red dots). (B) Successful learning was achieved by using 10 randomly-selected sets of CPSs that satisfied the criteria (the selections are indicated as black dots in [A]). The success rate was improved from 66.7% (10/15, see Figure 4) to 100% (10/10). The same representations are used as in Figure 4.
Figure 7
Figure 7. Network plasticity was essential for successful learning in the system.
The successful adaptation in the overall system was contributed by learning in the network, and was not solely a product of the adaptive process in the artificial training algorithm. (A) The distances between the animat and the origin in a successful-learning simulation (with STDP, gray curve with gray shading for clarity) and the corresponding simulation without STDP (blue curve). The desired behavior could not be restored without the STDP algorithm. (B) The comparison of learning curves, defined as the change in probability of successful behavior over time, for simulations in (A). (C) Among 10 original successful-learning simulations, the average probability of successful behavior before the switch was 63.3±3.5%, dropped significantly to 9.8±1.1% after the switch (*p<5e-4, Wilcoxon signed-rank test), and increased significantly back to 53.6±3.5% when the desired behavior was restored (*, p<5e-4). These periods are shown in (B) (Pre: the 10 minutes before the switch; Switch: the 10 minutes immediately after the switch; and Post: the last 10 minutes). The probabilities of successful behavior in Pre and Post were comparable (p = 0.09). For all corresponding simulations without the STDP algorithm, the probability of successful behavior before the switch was 68.4±4.6% (n = 10 simulations without STDP), dropped significantly to 6.2±0.8% after the switch (*p<5e-4), but showed non-significant increase by the last 10 minutes of the simulation (6.4±0.9%; p = 0.91). This indicates that network long-term plasticity was essential for successful learning in the closed-loop system.
Figure 8
Figure 8. Successful adaptation required not only one PTS but a certain sequence of PTSs.
(A) The training history of a successful-learning simulation (the distance measure is shown on the top panel). PTSs delivered from four different pools (PTSQ1–PTSQ4) are shown as black crosses, and the occurrences of RBS are shown as green crosses. From the 660 possible PTSs, the index of PTSs delivered most frequent in Q1, Q2, Q3, and Q4 were 575, 605, 423, and 584, respectively. The electrode locations and PTSt of these four most frequent PTS patterns are shown on the right. For each pool, the location of the first electrode (PTS-E1, also the probe electrode, see Methods and Figure 1) is shown as a black X in the grids of 60 electrodes, and the second electrode (PTS-E2k) is shown as a blue dot. PTSt between the PTS-E1 (black arrow) and PTS-E2k (blue arrow) is also indicated for these four PTSs. (B) The learning curves of the successful-learning simulation shown in (A) (gray curve) and the corresponding simulation with only the most frequent PTSs available for training (blue curve, see Methods). In this example, the PTS patterns used for training in Q1, Q2, Q3, and Q4 were PTSs #575, 605, 423, and 584, respectively (see [A]). (C) The average probabilities of successful behavior during Switch and Pre periods (shown in [B]) in 10 original successful-learning simulations and 10 corresponding new simulations with only single PTS pattern available for training in each quadrant. For the original simulations, the average probability of successful behavior increased significantly back after the desired behavior was restored (*p<5e-4), while the average probability remained low for the simulations with single-PTS training (p = 0.61).
Figure 9
Figure 9. Behavior-contingent training was necessary for successful learning.
A comparison between experiments with behavior-contingent training and with replayed training stimulation (non-contingent). (A) With real-time behavior-contingent training, the animat in this example was able to adapt to a sensory mapping switch and reach the desired behavior: moving in desired directions in each quadrant and staying within the inner circle (gray curve with gray shading for clarity). The adaptation was absent in the non-contingent experiment (blue curve). (B) The comparison of the learning curves corresponding for the example in (A). (C) The average probabilities of successful behavior in the 10 successful-learning experiments and the corresponding non-contingent experiments. With behavior-contingent training, the average probability of successful behavior in the last 10 minutes of the simulations (Post period shown in [B]) was significantly greater than that measured within 10 minutes after the switch (Switch) (*p<5e-4). In non-contingent experiments, the average probability of successful behavior in Post was comparable to that in Switch (p = 0.47). (D) The changes in all synaptic weights were visualized by Principal Components Analysis (PCA). The first three components (PC1 to PC3) of the network synaptic weights in the same example as (A) and (B) are plotted over time. Starting from the same initial synaptic weights, the network diverged to different synaptic weight distributions as the training became progressively less contingent on the network activity and the animat's performance. The circled periods, Pre and Post, are indicated at the bottom of (A).
Figure 10
Figure 10. The “solution” for successful goal-directed behavior is not unique.
The network re-adapted to reapplication of the original sensory mapping via a different state of network synaptic weights. (A) After the network adapted to a switch of the sensory mapping (Post1 period), the sensory mapping was switched back to see whether the network could re-adapt to the original sensory mapping. One example is shown. The animat was able to restore the desired behavior (Post2) after the switch-back. (B) After adaptation to the switch-back, the animat showed the same desired behavior under the same sensory mapping, but with a different set of network synaptic weights. Multiple solutions existed for the desired behavior.

References

    1. Potter SM, Fraser SE, Pine J. Animat in a petri dish: Cultured neural networks for studying neural computation. Proc 4th Joint Symposium on Neural Computation, UCSD. 1997:167–174.
    1. DeMarse TB, Wagenaar DA, Blau AW, Potter SM. The neurally controlled animat: Biological brains acting with simulated bodies. Auton Robots. 2001;11:305–310. - PMC - PubMed
    1. Potter SM, Wagenaar DA, DeMarse TB. Closing the loop: Stimulation feedback Systems for embodied MEA cultures. In: Taketani M, Baudry M, editors. Advances in network electrophysiology using multi-electrode arrays. New York: Springer; 2006. pp. 215–242.
    1. Meyer JA, Wilson SW. From Animals to animats: Proceedings of the First International Conference on Simulation of Adaptive Behavior. Cambridge: MIT Press; 1991.
    1. Shefi O, Golding I, Segev R, Ben-Jacob E, Ayali A. Morphological characterization of in vitro neuronal networks. Phys Rev E. 2002;66:021905. - PubMed

Publication types