. 2008 Mar 7;4(3):e1000016.
doi: 10.1371/journal.pgen.1000016.

Transcription and chromatin organization of a housekeeping gene cluster containing an integrated beta-globin locus control region

Affiliations

Transcription and chromatin organization of a housekeeping gene cluster containing an integrated beta-globin locus control region

Daan Noordermeer et al. PLoS Genet. .

Erratum in

  • PLoS Genet. 2008 Mar;4(3). doi: 10.1371/annotation/b4241c5d-5403-4797-8579-913ef9be560b. Pombo, Ana [added]

Abstract

The activity of locus control regions (LCR) has been correlated with chromatin decondensation, spreading of active chromatin marks, locus repositioning away from its chromosome territory (CT), increased association with transcription factories, and long-range interactions via chromatin looping. To investigate the relative importance of these events in the regulation of gene expression, we targeted the human beta-globin LCR in two opposite orientations to a gene-dense region in the mouse genome containing mostly housekeeping genes. We found that each oppositely oriented LCR influenced gene expression on both sides of the integration site and over a maximum distance of 150 kilobases. A subset of genes was transcriptionally enhanced, some of which in an LCR orientation-dependent manner. The locus resides mostly at the edge of its CT and integration of the LCR in either orientation caused a more frequent positioning of the locus away from its CT. Locus association with transcription factories increased moderately, both for loci at the edge and outside of the CT. These results show that nuclear repositioning is not sufficient to increase transcription of any given gene in this region. We identified long-range interactions between the LCR and two upregulated genes and propose that LCR-gene contacts via chromatin looping determine which genes are transcriptionally enhanced.


Conflict of interest statement

The authors have declared that no competing interests exist.

Figures

Figure 1
Figure 1. Targeting of the β-globin LCR into the murine gene-dense region 8C3/C4.
(A) 3 Mb region containing 79 genes (NCBI assembly m34). Location on murine chromosome 8 is depicted below the region. Human synteny and cytogenic chromosome bands are depicted on top. (B) Zoom in on 300 kb region containing 18 genes characterized in this study (NCBI assembly m34). Genes are numbered relative to the center gene Rad23a (gene 0). Location on murine chromosome 8 is depicted below the region. (C) The full human β-globin LCR, linked to a puromycin selection marker, was integrated in sense orientation (LCR-S, blue) and anti-sense orientation (LCR-AS, red) relative to Rad23a, removing exons II–VII from the Rad23a gene. Hypersensitive sites (HSs) in the LCR are numbered and represented by shaded boxes. (D) Southern blot showing targeting of the LCR into the Rad23a locus. Positive clones are indicated by red arrows. Note that targeting is extremely efficient. (E) DnaseI hypersensitivity of HSs in the integrated LCR in the sense orientation. E14.5 fetal liver DNA was digested with increasing amounts of DnaseI and DNA fragments containing the respective HSs were visualized by Southern blotting. Hypersensitive DNA fragments are indicated by arrows. LCR-AS HSs showed comparable patterns (not shown).
Figure 2
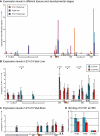
Figure 2. Gene expression in different tissues at 8C3/C4.
(A) Expression levels in fetal liver, fetal brain and adult liver of genes at 8C3/C4 represented on murine Affymetrix 430 2.0 Micro-array. NP: not present on the micro-array. (B) Upregulation of gene expression relative to WT levels (for each gene set at 1) in strains with the human β-globin LCR integrated at the Rad23a locus (orange). Expression levels were determined in E14.5 fetal liver using qRT-PCR. Error bars depict 95% confidence intervals obtained from a Student's t-test using the Welch-Satterthwaite approximation for the degrees of freedom. P-values of significant differences in expression levels measured between the two oppositely LCRs are shown above the relevant genes. (C) Upregulation of gene expression relative to WT levels (for each gene set at 1) in E14.5 fetal brain containing the human β-globin LCR. Expression levels were determined using qRT-PCR. Error bars depict 95% confidence intervals. (D) Binding of CTCF at HS5 of the human β-globin LCR (hHS5), as determined by ChIP-analysis in E14.5 fetal liver. Enrichments were normalized to the endogenous β-major promoter. Endogenous β-globin HS5 (mHS5) is shown as a control. Error bars represent SE of at least two independent experiments.
Figure 3
Figure 3. Effect of LCR insertion on the positioning of 8C3/C4 in relation to its CT.
(A) Cryosections from WT, LCR-S and LCR-AS fetal liver nuclei were hybridized to a BAC probe containing the 8C3/C4 locus (red) and a chromosome 8 specific paint (green). Bars, 1 µm. (B) After cryo-FISH, the distances from the center of each locus to the nearest CT edge were measured (n≥237 loci). Statistically significant differences were found between the wild-type locus and both transgenic loci containing the LCR (p<0.001, K-S test). (C) Distances between 8C3/C4 and the CT edge were measured for sections from WT (n = 59 loci) and LCR-AS (n = 135 loci) fetal brain, showing no differences between the two populations (p = 0.45, K-S test). Bars, 1 µm.
Figure 4
Figure 4. Effect of LCR insertion on the association of 8C3/C4 with transcription factories.
(A) Nuclear sections from WT and LCR-S fetal livers (blue) were immunolabeled with an antibody against the Ser2-phosphorylated form of RNAP II (green), hybridized to the 8C3/C4 BAC probe (red), and the association of the locus with transciption factories was scored (n≥231 loci). Bars, 1 µm. (B) To obtain an unbiased measurement of factory association, distances were measured between the centres of 8C3/C4 loci and the nearest RNAP II focus, showing significant differences in the distances distributions between WT and LCR-S loci (p = 0.003, K-S test). Both loci are found in closer proximity to transcription factories than predicted by a random model (p<0.001, K-S test), in which loci were randomly placed inside experimental images of RNAP II-labeled nuclei and distances measured. (C) The active form of RNAP II (blue or grayscale), 8C3/C4 (red; arrows) and chromosome 8 (green) were labeled as before. The nucleus is outlined by a white line. Bars, 1 µm. (D) Distances of 8C3/C4 loci to the nearest CT edge and transcription factory were measured after performing the triple labeling described above (C) in sections from WT and LCR-S fetal livers. The frequency of loci <0.2 µm away from a transcription factory was calculated within each position relative to the CT.
Figure 5
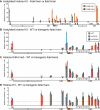
Figure 5. Chromatin organization at 8C3/C4 in the presence of the LCR.
(A) Histone H3 acetylation at promoters (▴) and other regions (*) of 8C3/C4 in WT E14.5 fetal liver and brain as determined by ChIP-analysis. Enrichments were normalized to the Amylase promoter. (B) Histone H3 acetylation at 8C3/C4 in WT and transgenic strains in E14.5 fetal liver. Enrichments were normalized to the Amylase promoter. (C) Histone H3 lysine 4 tri-methylation at 8C3/C4 in WT and transgenic strains in E14.5 fetal liver. Enrichments were normalized to the endogenous β-major promoter. (D) Histone H3 occupancy at 8C3/C4 in WT and transgenic strains in E14.5 fetal liver. Enrichments were normalized to the endogenous β-major promoter. Error bars in all graphs represent standard error (SE) of at least two independent experiments.
Figure 6
Figure 6. Chromatin looping at 8C3/C4 in the presence of the LCR.
Relative crosslink frequencies (vs. random) in a part of the 300 kb region containing the two most upregulated genes (genes −2, Dand5 and +6, Dnase2a). Crosslink frequencies between the fixed BglII fragment, depicted by a black bar, containing either the WT Rad23a gene or the LCR and other fragments, depicted by gray bars are visualized, as determined by 3C analysis and quantified by qPCR in WT and transgenic E14.5 fetal liver. Note that for the fixed fragment in each strain the same primer and Taqman probe combination was used. Error bars represent SE of at least three independent experiments.

References

    1. Epner E, Reik A, Cimbora D, Telling A, Bender MA, et al. The beta-globin LCR is not necessary for an open chromatin structure or developmentally regulated transcription of the native mouse beta-globin locus. Mol Cell. 1998;2:447–455. - PubMed
    1. Grosveld F, van Assendelft GB, Greaves DR, Kollias G. Position-independent, high-level expression of the human beta-globin gene in transgenic mice. Cell. 1987;51:975–985. - PubMed
    1. Ho Y, Elefant F, Cooke N, Liebhaber S. A defined locus control region determinant links chromatin domain acetylation with long-range gene activation. Mol Cell. 2002;9:291–302. - PubMed
    1. Routledge SJ, Proudfoot NJ. Definition of transcriptional promoters in the human beta globin locus control region. J Mol Biol. 2002;323:601–611. - PubMed
    1. Ling J, Ainol L, Zhang L, Yu X, Pi W, et al. HS2 enhancer function is blocked by a transcriptional terminator inserted between the enhancer and the promoter. J Biol Chem. 2004;279:51704–51713. - PubMed

Publication types

Associated data

LinkOut - more resources