. 2008 Mar 21;4(3):e1000032.
doi: 10.1371/journal.pgen.1000032.

Global analysis of genetic, epigenetic and transcriptional polymorphisms in Arabidopsis thaliana using whole genome tiling arrays

Affiliations

Global analysis of genetic, epigenetic and transcriptional polymorphisms in Arabidopsis thaliana using whole genome tiling arrays

Xu Zhang et al. PLoS Genet. .

Erratum in

  • PLoS Genet. 2008 Jun;4(6). doi: 10.1371/annotation/e21d3565-fec6-44d9-8fab-83da49c7c0b8. Shiu, Shinhan [corrected to Shiu, Shin-Han]

Abstract

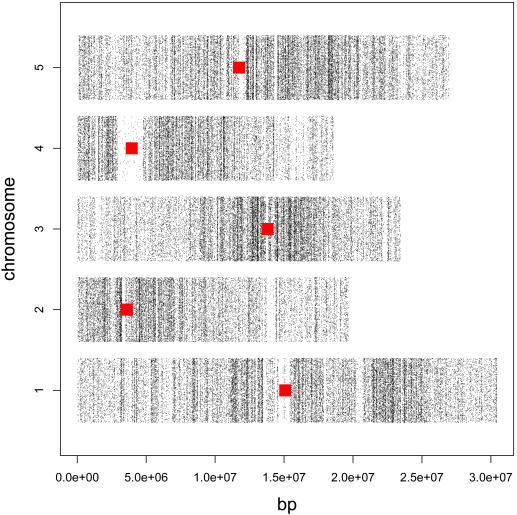
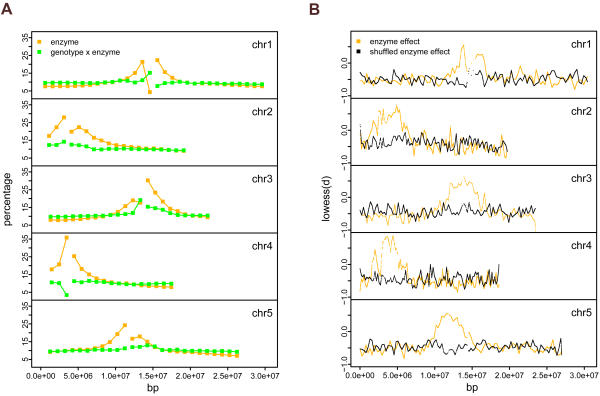
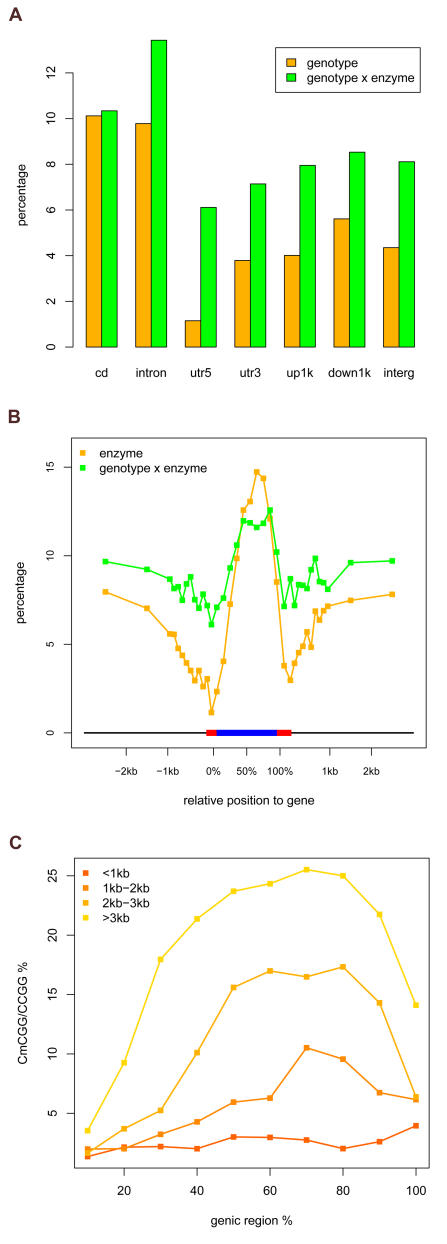
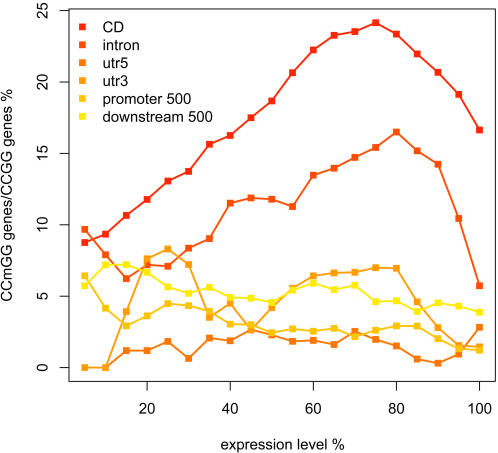
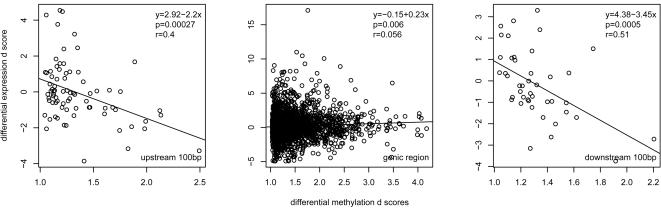
Whole genome tiling arrays provide a high resolution platform for profiling of genetic, epigenetic, and gene expression polymorphisms. In this study we surveyed natural genomic variation in cytosine methylation among Arabidopsis thaliana wild accessions Columbia (Col) and Vancouver (Van) by comparing hybridization intensity difference between genomic DNA digested with either methylation-sensitive (HpaII) or -insensitive (MspI) restriction enzyme. Single Feature Polymorphisms (SFPs) were assayed on a full set of 1,683,620 unique features of Arabidopsis Tiling Array 1.0F (Affymetrix), while constitutive and polymorphic CG methylation were assayed on a subset of 54,519 features, which contain a 5'CCGG3' restriction site. 138,552 SFPs (1% FDR) were identified across enzyme treatments, which preferentially accumulated in pericentromeric regions. Our study also demonstrates that at least 8% of all analyzed CCGG sites were constitutively methylated across the two strains, while about 10% of all analyzed CCGG sites were differentially methylated between the two strains. Within euchromatin arms, both constitutive and polymorphic CG methylation accumulated in central regions of genes but under-represented toward the 5' and 3' ends of the coding sequences. Nevertheless, polymorphic methylation occurred much more frequently in gene ends than constitutive methylation. Inheritance of methylation polymorphisms in reciprocal F1 hybrids was predominantly additive, with F1 plants generally showing levels of methylation intermediate between the parents. By comparing gene expression profiles, using matched tissue samples, we found that magnitude of methylation polymorphism immediately upstream or downstream of the gene was inversely correlated with the degree of expression variation for that gene. In contrast, methylation polymorphism within genic region showed weak positive correlation with expression variation. Our results demonstrated extensive genetic and epigenetic polymorphisms between Arabidopsis accessions and suggested a possible relationship between natural CG methylation variation and gene expression variation.


Conflict of interest statement

The authors have declared that no competing interests exist.

Figures

Figure 1
Figure 1. Genomic Distribution of SFPs.
The base positions (x-axis) for 120,810 SFPs (FDR 1%) with greater Col intensity were plotted along chromosomes (y-axis). Red bars indicated the positions of BAC clones for centromere sequences (http://www.ncbi.nlm.nih.gov/mapview).
Figure 2
Figure 2. Genomic Distribution of Constitutive and Polymorphic CG Methylation Sites.
(A) Percent constitutive (orange) or polymorphic (green) CG methylation sites (y-axis) along chromosomes. The x-axis indicated the chromosome positions in bp. The gaps on each chromosome indicated the positions of BAC clones for centromere sequences. Each chromosome was divided into 1 Mb bins starting from the ends of the centromere gap toward chromosome arms. For each bin, percent constitutive or polymorphic CG methylation sites was calculated as the number of features containing constitutive or polymorphic CG methylation divided by the number of CCGG-containing features. (B) Co-methylation along chromosomes. The d scores of enzyme effect for 54,519 CCGG-containing features were Lowess-smoothed with a window size of 200 kb (orange), or were shuffled by 1 kb block and Lowess-smoothed with a window size of 200 kb as a null distribution (black). The smoothed d scores (y-axis) were plotted along chromosome positions (x-axis).
Figure 3
Figure 3. Genic Distribution of Constitutive and Polymorphic CG Methylation Sites.
(A) Percent constitutive (orange) and polymorphic (green) CG methylation sites was calculated for seven annotation categories: coding sequence (CD); intron, 5′ UTR (utr5), 3′ UTR (utr3), sequence from transcriptional start to upstream 1 kb (up1k), sequence from transcriptional stop to downstream 1 kb (down1k), and inter-genic sequence (interg). (B) Percent constitutive (orange) and polymorphic (green) CG methylation sites was calculated along a typical gene. The results were based on all annotated genes possessing CCGG-containing feature(s) within the analyzed region. Gene sequences flanked by UTRs were divided to 10 percentiles based on position, upstream and downstream sequences were each divided to ten 100 bp intervals and two 1 kb intervals. Percent constitutive and polymorphic CG methylation sites was calculated for each interval and plotted as y-axis along a virtual gene of size 1900 bp (including 100 bp 5′UTR and 200 bp 3′UTR). Black lines: upstream and downstream sequences; red bar: UTRs; blue bar: gene sequences flanked by UTRs. The x-axis indicated the relative positions to the virtual gene. (C) Correlation between the size of gene (sequence flanked by UTRs) and the level of constitutive CG methylation. Genes possessing CCGG-containing feature(s) were separated to 4 groups based on their size. Within each group, gene regions were divided to 10 percentiles based on position, and the percent constitutive CG methylation (y-axis) was calculated for each percentile (x-axis).
Figure 4
Figure 4. Correlation between Constitutive CG Methylation and Absolute Gene Expression Level.
Genes possessing CCGG-containing feature(s) within analyzed sequence category were divided to 20 percentiles based on absolute gene expression level. Within each expression percentile (x-axis), percent genes with constitutive CG methylation site(s) was plotted as y-axis. The analyzed annotation categories were: coding sequences (CD); 5′ UTRs (utr5); 3′ UTRs (utr3); sequences from transcriptional start to upstream 500 bp (promoter 500); sequences from transcriptional stop to downstream 500 bp (downstream 500).
Figure 5
Figure 5. Correlation between CG Methylation Polymorphisms and Differential Gene Expressions.
Differential gene expression d scores (y-axis) were linear regressed against d scores of genotype×enzyme effect (x-axis) for features within 100 bp upstream from transcriptional start (left panel), genic region (middle panel) and 100 bp downstream from transcriptional stop (right panel).

References

    1. Bird AP. DNA methylation and the frequency of CpG in animal DNA. Nucleic Acids Res. 1980;8:1499–1504. - PMC - PubMed
    1. Kato M, Miura A, Bender J, Jacobsen SE, Kakutani T. Role of CG and non-CG methylation in immobilization of transposons in Arabidopsis. Curr Biol. 2003;13:421–426. - PubMed
    1. Selker EU. Genome defense and DNA methylation in Neurospora. Cold Spring Harb Symp Quant Biol. 2004;69:119–124. - PubMed
    1. Buard J, de Massy B. Playing hide and seek with mammalian meiotic crossover hotspots. Trends Genet. 2007;23:301–309. - PubMed
    1. Klose RJ, Bird AP. Genomic DNA methylation: the mark and its mediators. Trends Biochem Sci. 2006;31:89–97. - PubMed

Publication types