

Genetic networks of liver metabolism revealed by integration of metabolic and transcriptional profiling
- PMID: 18369453
- PMCID: PMC2265422
- DOI: 10.1371/journal.pgen.1000034
Genetic networks of liver metabolism revealed by integration of metabolic and transcriptional profiling
Erratum in
- PLoS Genet. 2008 Jul;4(7). doi: 10.1371/annotation/7989839d-0677-4f59-a218-f4ebb6fd0b66 doi: 10.1371/annotation/7989839d-0677-4f59-a218-f4ebb6fd0b66
Abstract
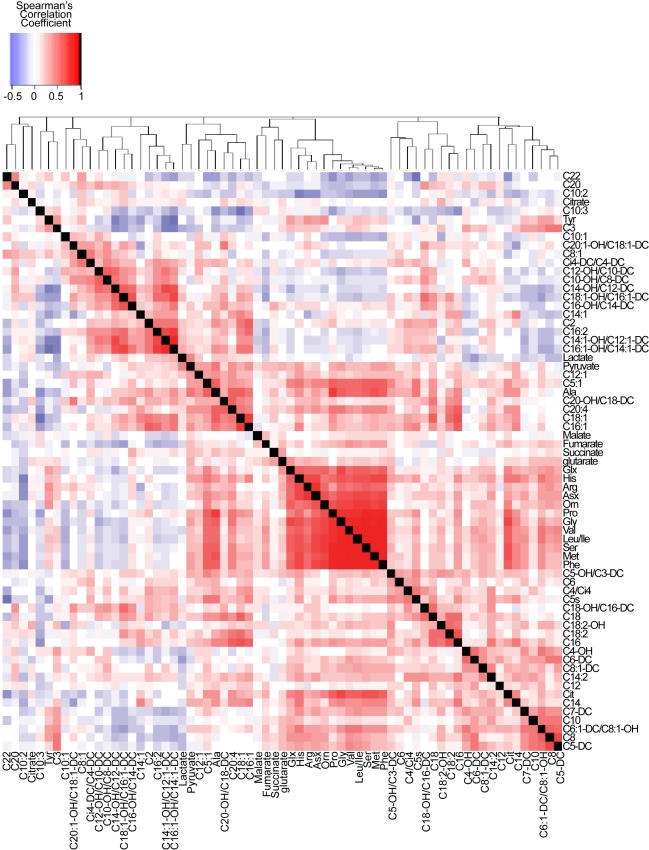
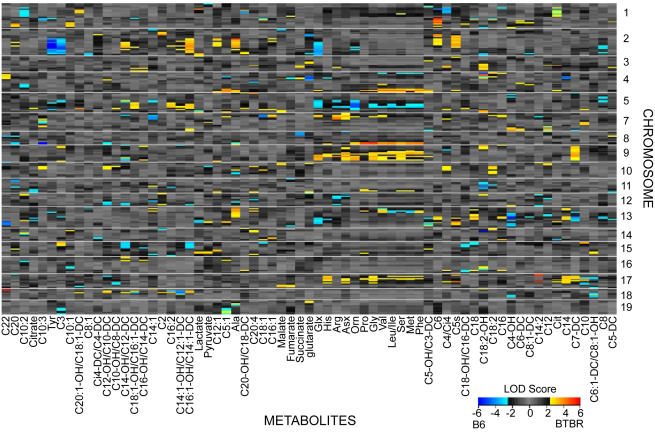
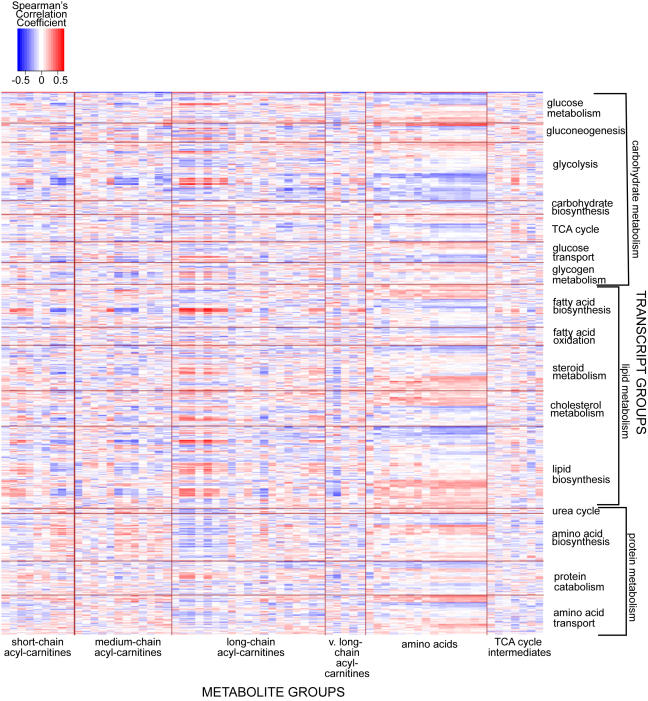
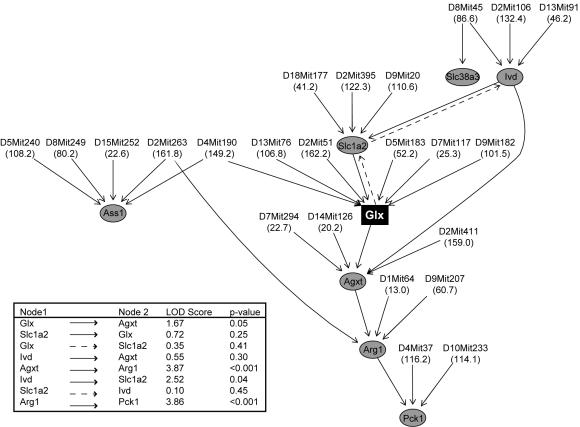
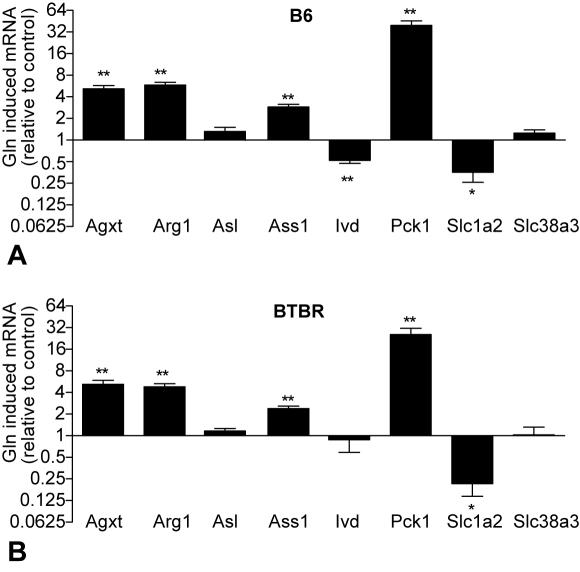
Although numerous quantitative trait loci (QTL) influencing disease-related phenotypes have been detected through gene mapping and positional cloning, identification of the individual gene(s) and molecular pathways leading to those phenotypes is often elusive. One way to improve understanding of genetic architecture is to classify phenotypes in greater depth by including transcriptional and metabolic profiling. In the current study, we have generated and analyzed mRNA expression and metabolic profiles in liver samples obtained in an F2 intercross between the diabetes-resistant C57BL/6 leptin(ob/ob) and the diabetes-susceptible BTBR leptin(ob/ob) mouse strains. This cross, which segregates for genotype and physiological traits, was previously used to identify several diabetes-related QTL. Our current investigation includes microarray analysis of over 40,000 probe sets, plus quantitative mass spectrometry-based measurements of sixty-seven intermediary metabolites in three different classes (amino acids, organic acids, and acyl-carnitines). We show that liver metabolites map to distinct genetic regions, thereby indicating that tissue metabolites are heritable. We also demonstrate that genomic analysis can be integrated with liver mRNA expression and metabolite profiling data to construct causal networks for control of specific metabolic processes in liver. As a proof of principle of the practical significance of this integrative approach, we illustrate the construction of a specific causal network that links gene expression and metabolic changes in the context of glutamate metabolism, and demonstrate its validity by showing that genes in the network respond to changes in glutamine and glutamate availability. Thus, the methods described here have the potential to reveal regulatory networks that contribute to chronic, complex, and highly prevalent diseases and conditions such as obesity and diabetes.
Conflict of interest statement
The authors have declared that no competing interests exist.
Figures
References
-
- DiPetrillo K, Wang X, Stylianou IM, Paigen B. Bioinformatics toolbox for narrowing rodent quantitative trait loci. Trends Genet. 2005;21:683–692. - PubMed
-
- Glazier AM, Nadeau JH, Aitman TJ. Finding genes that underlie complex traits. Science. 2002;298:2345–2349. - PubMed
-
- Guo SW, Lange K. Genetic mapping of complex traits: promises, problems, and prospects. Theor Popul Biol. 2000;57:1–11. - PubMed
-
- Hirschhorn JN, Daly MJ. Genome-wide association studies for common diseases and complex traits. Nat Rev Genet. 2005;6:95–108. - PubMed
-
- Nadeau JH, Frankel WN. The roads from phenotypic variation to gene discovery: mutagenesis versus QTLs. Nat Genet. 2000;25:381–384. - PubMed
Publication types
MeSH terms
Substances
Grants and funding
LinkOut - more resources
Full Text Sources
Other Literature Sources
Molecular Biology Databases
Research Materials
Miscellaneous
