. 2008 Mar 21;4(3):e1000039.
doi: 10.1371/journal.pgen.1000039.

Recruitment to the nuclear periphery can alter expression of genes in human cells

Affiliations

Recruitment to the nuclear periphery can alter expression of genes in human cells

Lee E Finlan et al. PLoS Genet. .

Abstract

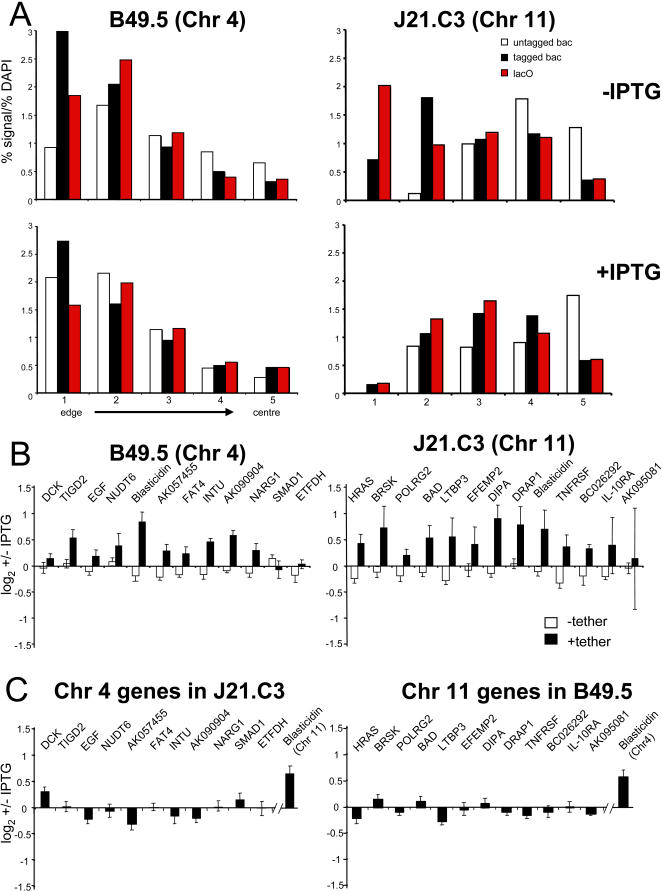
The spatial organisation of the genome in the nucleus has a role in the regulation of gene expression. In vertebrates, chromosomal regions with low gene-density are located close to the nuclear periphery. Correlations have also been made between the transcriptional state of some genes and their location near the nuclear periphery. However, a crucial issue is whether this level of nuclear organisation directly affects gene function, rather than merely reflecting it. To directly investigate whether proximity to the nuclear periphery can influence gene expression in mammalian cells, here we relocate specific human chromosomes to the nuclear periphery by tethering them to a protein of the inner nuclear membrane. We show that this can reversibly suppress the expression of some endogenous human genes located near the tethering sites, and even genes further away. However, the expression of many other genes is not detectably reduced and we show that location at the nuclear periphery is not incompatible with active transcription. The dampening of gene expression around the nuclear periphery is dependent on the activity of histone deacetylases. Our data show that the radial position within the nucleus can influence the expression of some, but not all, genes. This is compatible with the suggestion that re-localisation of genes relative to the peripheral zone of the nucleus could be used by metazoans to modulate the expression of selected genes during development and differentiation.


Conflict of interest statement

The authors have declared that no competing interests exist.

Figures

Figure 1
Figure 1. Establishing the lacO/lacI Tethering System.
(A) Map of pCAGASIZ74 encoding myc-lacI -lap2β under the control of the CAG (CMV-chicken actin) promoter. (B) Western blot of fractionated extracts from cells transfected with pCAGASIZ74 and detected with antibody that recognises all isoforms of lap2, - untransfected cells; T- total cell extract; N –nuclear extract; C – cytoplasmic extract; Np – insoluble nuclear extract; Ns – soluble nuclear extract. (C) Western blot with antibody detecting the myc tag on cell lines with lacO sites in chromosome 11 (J1-C3) and stably expressing the myc-tagged lacI-lap2β; J21 = lacO integrated cells without lacI-lap2β, +ve control = transiently transfected cells. (D) Western blot with antibody detecting lacI in the lacO integrated parental B49.5 cells, and in B49.5 and J21 cells stably expressing lacI-lap2β. (E) Immunofluorescence on parental B49.5 lacO integrated cells and B49.5 cells stably expressing lacI-lap2β with antibodies that recognise lacI, myc or lap2. Nuclei are counterstained with DAPI.
Figure 2
Figure 2. Subnuclear Localisation of lacO-Tagged Chromosomes.
(A) 3D immuno-FISH on B49.5 cells expressing lacI fused to an INM protein, using a DNA probe for lacO and antibody detecting Lamin A. The single image plane shows lacO signals co-localised with foci of lamin A that are at invaginations of the nuclear envelope. Scale bar = 2 µm. (B) Approximate sites of lacO integration (red), determined from interphase FISH with genomic clones (green), on chromosomes 4 and 11 in cell lines B49.5 and J21.C3, respectively. Map position and location of genes is taken from the March 2006 (NCBI Build 36.1) Assembly of the human genome at UCSC (http://genome.ucsc.edu/cgi-bin/hgGateway). Details of clone positions are given in Table S1. (C) Interphase FISH with probes for lacO (red) and neighbouring BAC clones (green) in (top row) lacO tagged cell lines B49.5 and J21.C3 and (bottom row) these same cells lines now expressing lacI-lap2β. Scale bars = 2 µm. To the immediate right of each FISH image the histograms quantify the mean proportion of probe hybridisation signal, normalised to the proportion of DAPI stain (y axis), across the 5 concentric shells eroded from the periphery (shell 1) through to the centre (shell 5) of the nucleus (x axis), for the proximal BAC on the untagged chromosome (open bars) and on the tagged chromosome (black bars) and the lacO sites (red bars) in each of the parental and lacI-lap2β expressing cell lines. n = 35–50 for each cell line. (D) as in (C) but using probes for lacO (red) and chromosome paints (green).
Figure 3
Figure 3. Gene Expression Changes in lacO-Tagged Cell Lines.
(A) Frequency histograms of log2 tethered/untethered (i.e +/−lacI-lap2β) cDNA ratios for a moving average of 5 genes in cell lines B49.5 (left) and J21.C3 (right). Data for the whole genome (shaded in grey) are compared to the data from the whole of the respective tethered chromosome (red line) or for windows of +/−5 and 1 Mb (green and blue dashed lines respectively) centered around the site of lacO integration in each cell line. Dashed lines indicate the 99% confidence limits set from self-self hybridisations. (B) Mean log2 tethered/untethered (i.e +/−lacI-lap2β) cDNA ratios for genes in the 6 Mb near the lacO site on chromosome 4 in B49.5 cells (left) or the 1.5 Mb region close to lacO on chromosome 11 in J21.C3 cells (right). Mapping data and gene positions are relative to the May 2004 assembly of the human genome in the UCSC browser. (C) qRT-PCR analysis of endogenous genes on chromosome 4 (left) or chromosome11 (right) as well as the blasticidin gene that is in cis with the lacO sites. Graphs show the mean (+/−s.e.m) log2 tethered/untethered (i.e +/−lacI-lap2β) ratios from independent analyses, normalised to β-actin (white bars). Black bars indicate the log2 ratios obtained from the microarray analysis. Values along the x axis indicate estimated distance from lacO integration site in Mb (+values are telomeric of the integration site, −ve values are centromeric). (D) RNA FISH for blasticidin transcript (green) on B49.5 and J21.C3 untethered cells and the corresponding cell lines expressing lacI-lap2β (tethered). Scale bars = 2 µm.
Figure 4
Figure 4. Influence of Histone Deacetylase Inhibitors.
(A) qRT-PCR analysis, of endogenous genes on chromosome 4 in B49.5 cells (left) or genes on chromosome11 in J21.C3 cells (right), as well as the blasticidin gene that is in cis with the lacO sites, in mock-treated (DMSO) or TSA treated cells. Graphs show the mean (+/−s.e.m) log2 +/− TSA ratios from independent analyses, normalised to β-actin. Black bars; data from cells expressing the lacI-lap2β tether, white bars; parental cells with no tethering protein. (B) qRT-PCR analysis of endogenous genes on chromosome 4 in J21.C3 cells (left) or genes on chromosome11 in B49.5 cells (right) in mock-treated (DMSO) or TSA treated cells. (C) As in (A) but after treatment with sirtinol.
Figure 5
Figure 5. Reversibility of lacO-lacI Tethering and Gene Suppression.
(A) Histograms showing the mean proportion (%) of probe hybridisation signal, normalised to the proportion of DAPI stain (y axis), across the 5 concentric shells eroded from the periphery (shell 1) through to the centre (shell 5) of the nucleus (x axis), for a proximal BAC on the untagged chromosome (open bars) and on the tagged chromosome (black bars) and the lacO sites (red bars) in the lacI-lap2β expressing cell lines grown for 48 hours with (+) and without (−) IPTG. n = 50 for each cell line. (B) qRT-PCR analysis of expression from endogenous genes on chromosome 4 in B49.5 cells (left) or on chromosome11 in J21.C3 cells (right), as well as the blasticidin gene, in cells grown with (+) and without (−) IPTG. Graphs show the mean (+/−s.e.m) log2 +/− IPTG ratios from independent analyses normalised to β-actin. Black bars; data from cells expressing the lacI-lap2β tether, white bars; parental cells with no tethering protein. (C) qRT-PCR analysis of genes on chromosome 4 in J21.C3 cells (left) or genes on chromosome11 in B49.5 cells (right) expressing the lacI-lap2β tethering protein and treated with IPTG.

References

    1. Croft JA, Bridger JM, Boyle S, Perry P, Teague P, et al. Differences in the localization and morphology of chromosomes in the human nucleus. J Cell Biol. 1999;145:1119–1131. - PMC - PubMed
    1. Boyle S, Gilchrist S, Bridger JM, Mahy NL, Ellis JA, et al. The spatial organization of human chromosomes within the nuclei of normal and emerin-mutant cells. Hum Mol Genet. 2001;10:211–219. - PubMed
    1. Cremer M, Kupper K, Wagler B, Wizelman L, von Hase J, et al. Inheritance of gene density-related higher order chromatin arrangements in normal and tumor cell nuclei. J Cell Biol. 2003;162:809–820. - PMC - PubMed
    1. Cremer M, von Hase J, Volm T, Brero A, Kreth G, et al. Non-random radial higher-order chromatin arrangements in nuclei of diploid human cells. Chromosome Res. 2001;9:541–567. - PubMed
    1. Bolzer A, Kreth G, Solovei I, Koehler D, Saracoglu K, et al. Three-dimensional maps of all chromosomes in human male fibroblast nuclei and prometaphase rosettes. PLoS Biol. 2005;3:e157. - PMC - PubMed

Publication types

MeSH terms