. 2008 Mar 28;4(3):e1000045.
doi: 10.1371/journal.pgen.1000045.

Global chromatin domain organization of the Drosophila genome

Affiliations

Global chromatin domain organization of the Drosophila genome

Elzo de Wit et al. PLoS Genet. .

Abstract

In eukaryotes, neighboring genes can be packaged together in specific chromatin structures that ensure their coordinated expression. Examples of such multi-gene chromatin domains are well-documented, but a global view of the chromatin organization of eukaryotic genomes is lacking. To systematically identify multi-gene chromatin domains, we constructed a compendium of genome-scale binding maps for a broad panel of chromatin-associated proteins in Drosophila melanogaster. Next, we computationally analyzed this compendium for evidence of multi-gene chromatin domains using a novel statistical segmentation algorithm. We find that at least 50% of all fly genes are organized into chromatin domains, which often consist of dozens of genes. The domains are characterized by various known and novel combinations of chromatin proteins. The genes in many of the domains are coregulated during development and tend to have similar biological functions. Furthermore, during evolution fewer chromosomal rearrangements occur inside chromatin domains than outside domains. Our results indicate that a substantial portion of the Drosophila genome is packaged into functionally coherent, multi-gene chromatin domains. This has broad mechanistic implications for gene regulation and genome evolution.


Conflict of interest statement

The authors have declared that no competing interests exist.

Figures

Figure 1
Figure 1. Visualization of chromatin domains by “domainograms”.
To visualize local enrichment of a chromatin component, we calculate a probability score for the enrichment in a window of w neighboring genes under a null model in which all genes are randomly permuted. This calculation is done for all possible windows, ranging in size from a single gene to all genes on an entire chromosome arm, and for all possible window positions. A color scale (ranging from black for non-significant scores close to 1, to red for highly significant scores <10−6, see color scalebar) is used to visualize the probability scores in a triangular graph, which we term “domainogram”. Horizontally, each score is plotted at the chromosomal position of the center of the window, and vertically the windows are ordered by size. Thus, we obtain an intuitive visualization of local enrichments at all possible scales. See Methods for a detailed description. A) Domainogram of HP1 binding on the right arm of chromosome 2. B) Genomic map of HP1 binding used to generate the domainogram. C–D) domainogram plot and corresponding binding map after random permutation of the HP1 binding values along the genome. Genomic locations (Mb) are indicated below each graph in A–B.
Figure 2
Figure 2. Genome-wide domainograms reveal non-random local enrichment of chromatin components.
(A–C) domainograms for Lamin (A), D1 (B) and Mnt (C) along all major chromosome arms. Simple and nested patterns of local enrichment are visible. D) Domainogram comparison for Polycomb (mapped by DamID [21]) and H3K27me3 (mapped by ChIP [21]) on chromosome 3R. E) HP1 distribution on chromosome 2R in Kc167 cells grown in serum-containing (BPYE) and serum-free (HyQ) medium. A strong telomere-proximal region of enrichment is only observed in BPYE medium (indicated by the red bar). Data from BPYE medium is the same as in Fig. 1A–B. F) Domainograms of chromosome 2L for HP6 binding after RNAi of its binding partner HP1 and after a control RNAi (data from [24]). In D–F, only the bottom parts of the domainogram triangles are shown.
Figure 3
Figure 3. Identification of the most probable locations of discrete chromatin domains.
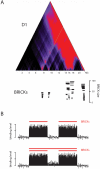
An algorithm based on dynamic programming (see Methods) was used to identify the most probable partitioning into discrete domains of local enrichment (BRICKs). A) Top panel: domainogram of D1 on chromosome arm 2L. Bottom panel: corresponding locations of identified BRICKs (up to a BRICK size of 100). Nested BRICK structures can be identified, in which large BRICKs overlap with smaller BRICKs. They are visualized as a stack of BRICKs, and are all used for subsequent functional analyses. B) Simplified cartoon illustrating that the BRICK detection algorithm only combines two smaller BRICKs into one larger BRICK if the protein binding values between the two smaller BRICKs are significantly elevated above background. Thus, higher-level BRICKs are not just a trivial consequence of two smaller BRICKS being in close proximity of one another.
Figure 4
Figure 4. BRICK locations for all tested proteins.
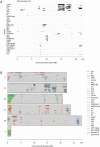
A) BRICKs on chromosome arm 2L. BRICKs smaller than 100 probed genes are shown for all analyzed proteins. The proteins are ordered by hierarchical clustering, with proteins that have the strongest overlapping domains closest together in the figure. B) Combined overview of the BRICKs for all proteins on all chromosome arms. BRICKs of different proteins are color-coded as indicated. Vertical position corresponds to the number of genes contained in the BRICK. Note that a substantial part of the Drosophila genome (∼50%) is covered by at least one BRICK.
Figure 5
Figure 5. Evidence for functional relevance of BRICKs.
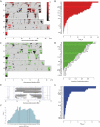
A–B) Developmental coexpression of genes within BRICKs. A) Combined BRICKs of all proteins as in Fig. 4B, colored for the relative degree of developmental coregulation of the genes within each BRICK (average pairwise correlation between all the genes in the domain). To be able to compare BRICKs of different sizes, we normalized the average pairwise correlation to a z-score by dividing by the standard deviation of 1000 average pairwise correlations of a random subset of n genes (see Text S1). B) Statistical significance of coregulation of genes within BRICKs, for each chromatin protein. For each BRICK a quantile score was determined, representing the rank of the coregulation in the BRICK, compared to the set of all equally-sized windows. The P-value was calculated using a Kolmogorov-Smirnov test for deviation from a uniform distribution, representing the null hypothesis that BRICKs do not show more coregulation than non-BRICK windows (see Text S1 for details). The dotted line indicates the significance threshold (p<0.001). C–D) Shared functions of genes within BRICKs. C) BRICKs that are significantly enriched for at least one GO category at an FDR cut-off of 1% are marked in green (see Methods). D) The fraction of GO-enriched BRICKs for every chromatin protein. Next to each bar are the absolute numbers of GO-enriched and total BRICKs, respectively. E–G). Reduced numbers of synteny breakpoints within BRICKs. E) Part of chromosome arm 2L, showing positions of synteny breakpoints (dotted blue vertical lines) relative to BRICKs (black horizontal lines). Note that breakpoints tend to be located just outside BRICKs. F) Statistical significance of exclusion of synteny breakpoints from BRICKs formed by Prospero. Combined BRICKs for all proteins, up to the indicated BRICK size, were tested for exclusion of synteny breaks using a hypergeometric test. G) Statistical significance of exclusion of synteny breaks from BRICKs separated by chromatin protein. The P-values are the smallest values taken from plots as in F) (see Supplementary Fig. S9).
Figure 6
Figure 6. Sequence properties of BRICKs.
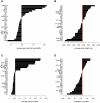
For each type of BRICK (defined by a single chromatin component) the average value is plotted for A) gene density; B) gene length; C) fraction of repetitive (i.e., non-unique) sequence; D) G/C content. All values are plotted as deviations from the genome-wide average (red vertical lines).

References

    1. Hurst LD, Pal C, Lercher MJ. The evolutionary dynamics of eukaryotic gene order. Nat Rev Genet. 2004;5:299–310. - PubMed
    1. Kosak ST, Groudine M. Gene order and dynamic domains. Science. 2004;306:644–647. - PubMed
    1. Sproul D, Gilbert N, Bickmore WA. The role of chromatin structure in regulating the expression of clustered genes. Nat Rev Genet. 2005;6:775–781. - PubMed
    1. de Laat W, Grosveld F. Spatial organization of gene expression: the active chromatin hub. Chromosome Res. 2003;11:447–459. - PubMed
    1. Kmita M, Duboule D. Organizing axes in time and space; 25 years of colinear tinkering. Science. 2003;301:331–333. - PubMed

Publication types