Comparative Study
. 2008 Apr;27(7):1876-92.
doi: 10.1111/j.1460-9568.2008.06166.x. Epub 2008 Mar 26.

Activation of phasic pontine-wave generator in the rat: a mechanism for expression of plasticity-related genes and proteins in the dorsal hippocampus and amygdala

Affiliations
Comparative Study

Activation of phasic pontine-wave generator in the rat: a mechanism for expression of plasticity-related genes and proteins in the dorsal hippocampus and amygdala

Subimal Datta et al. Eur J Neurosci. 2008 Apr.

Abstract

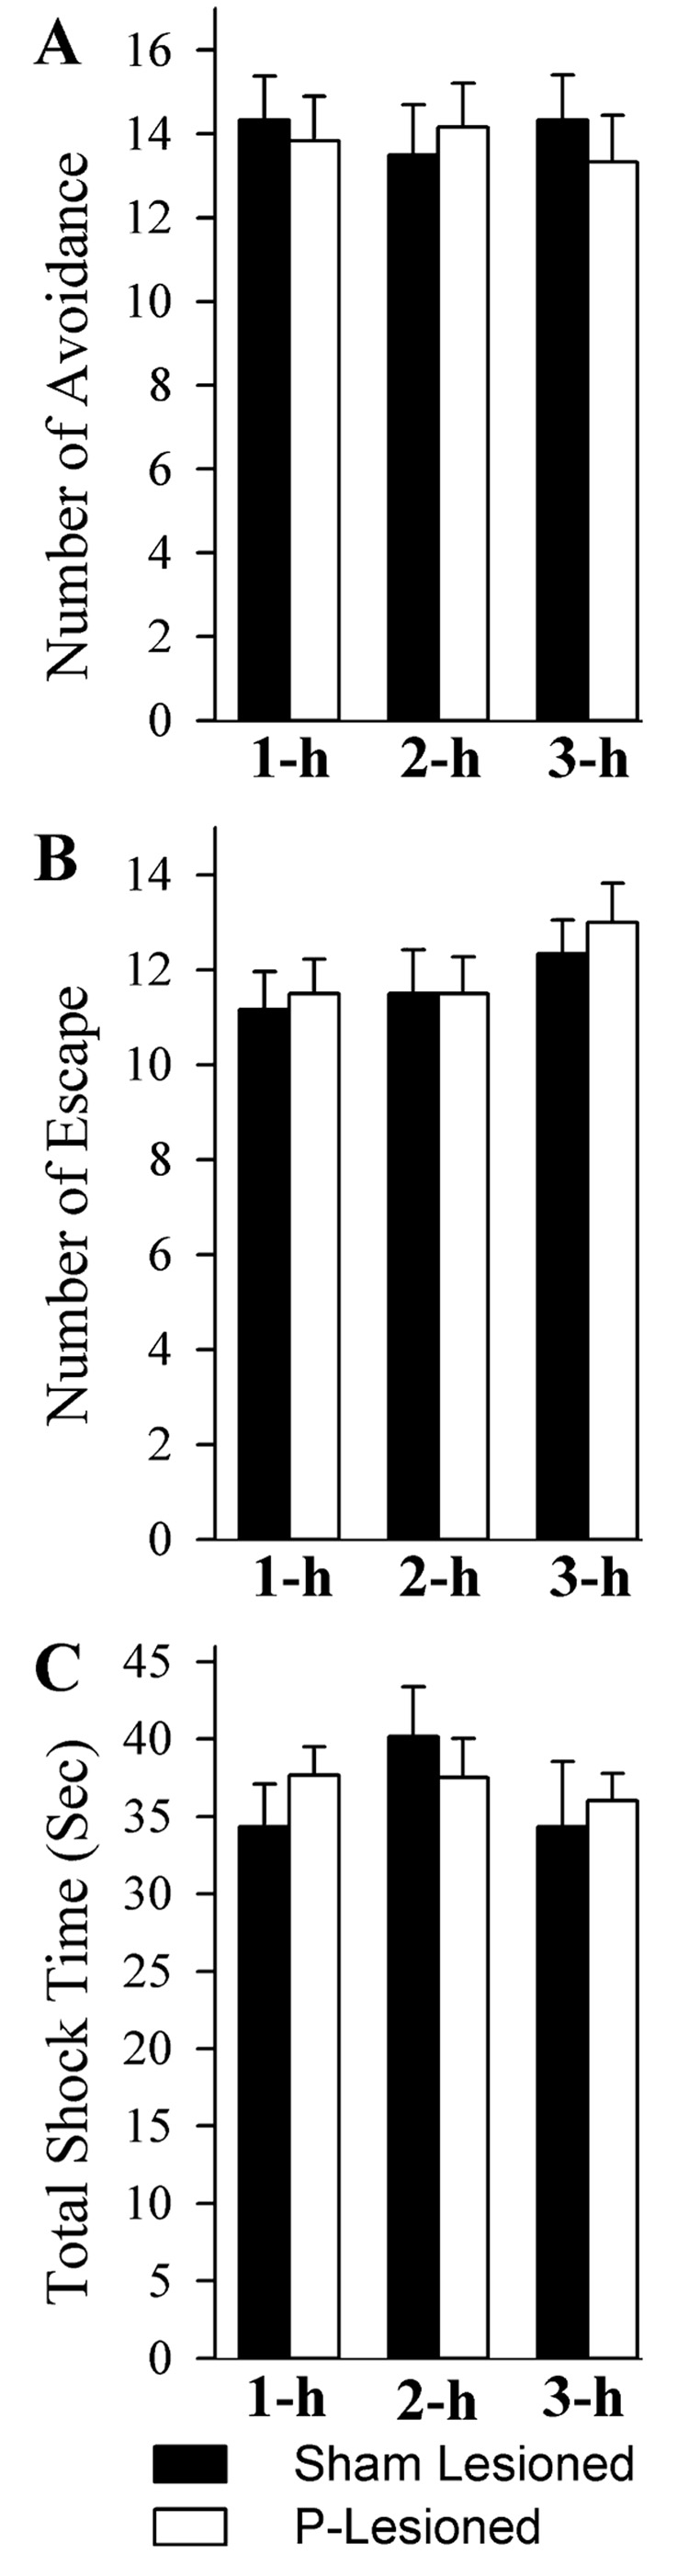
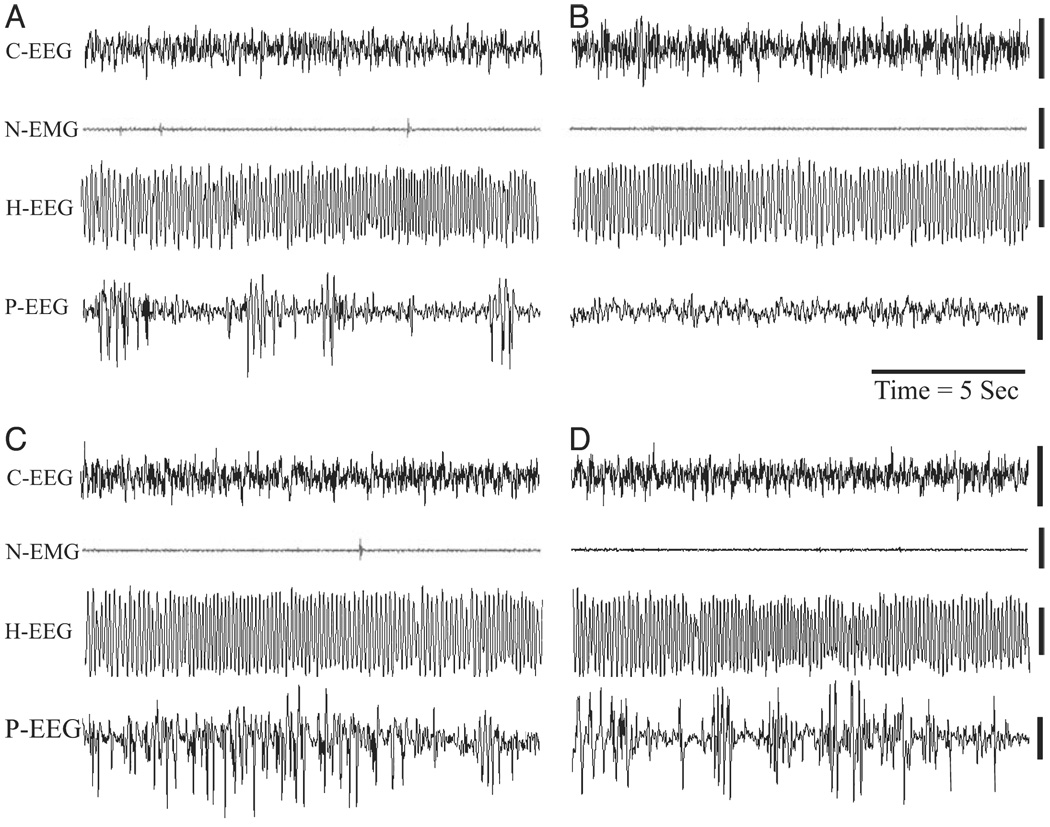
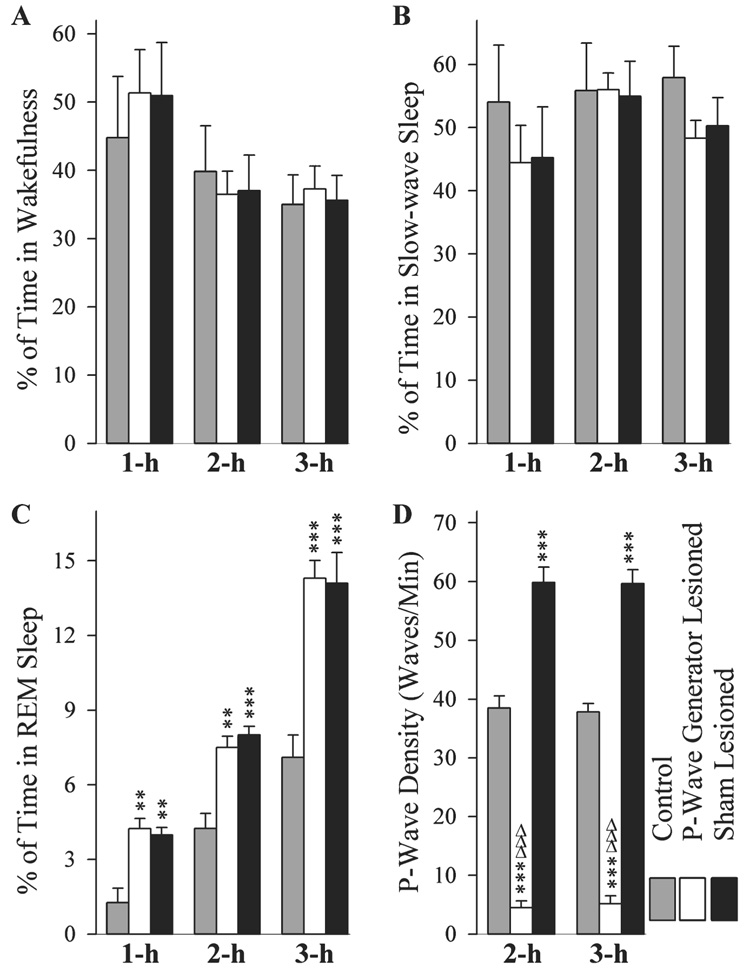
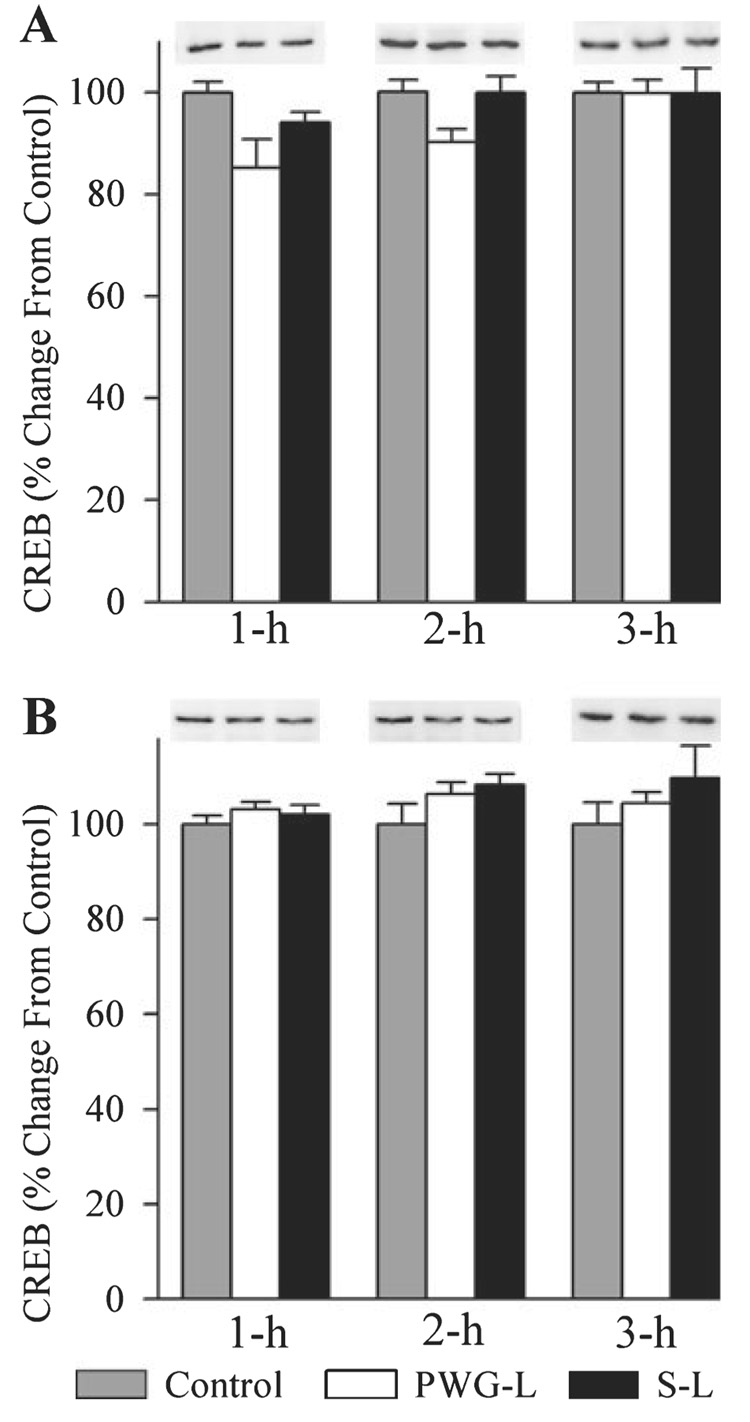
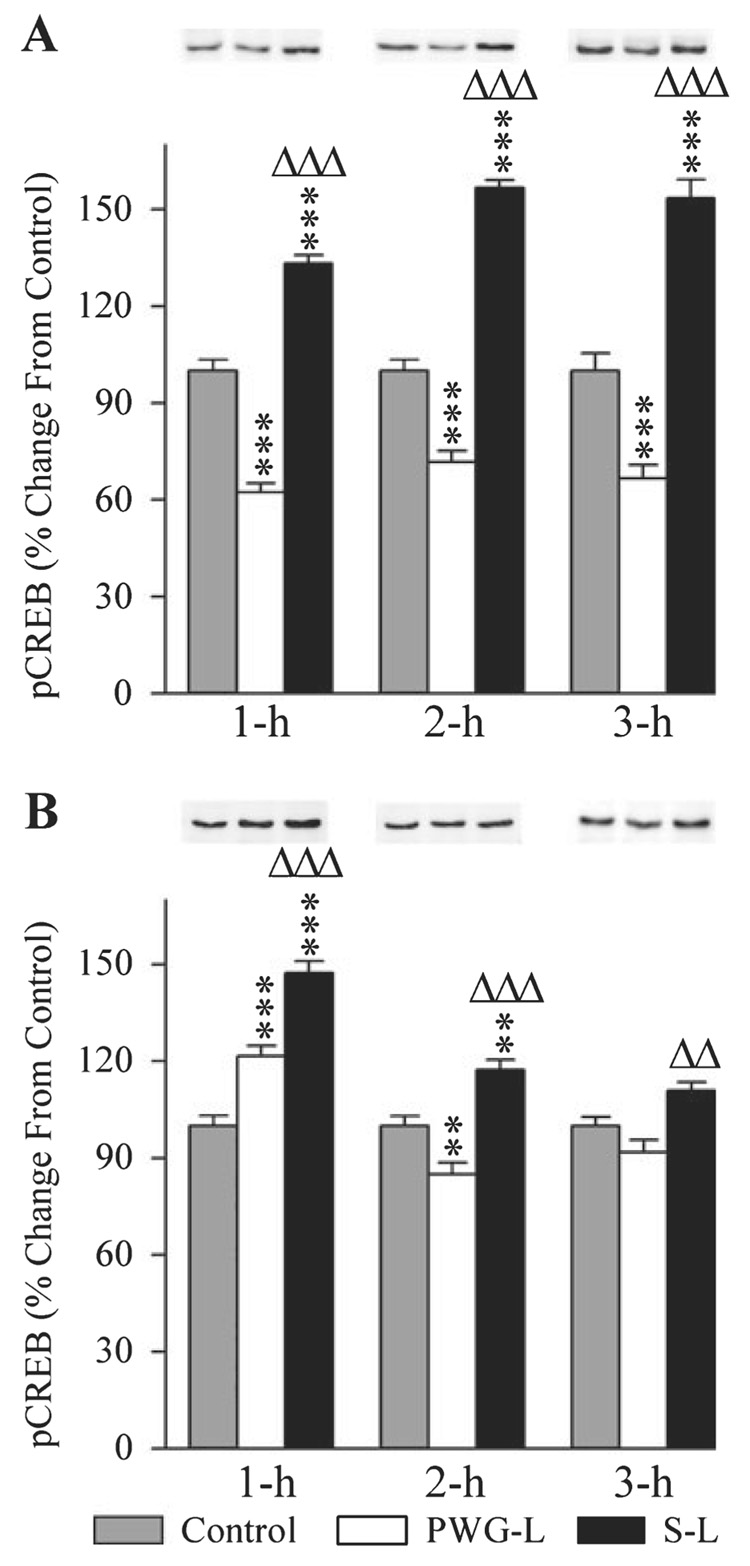
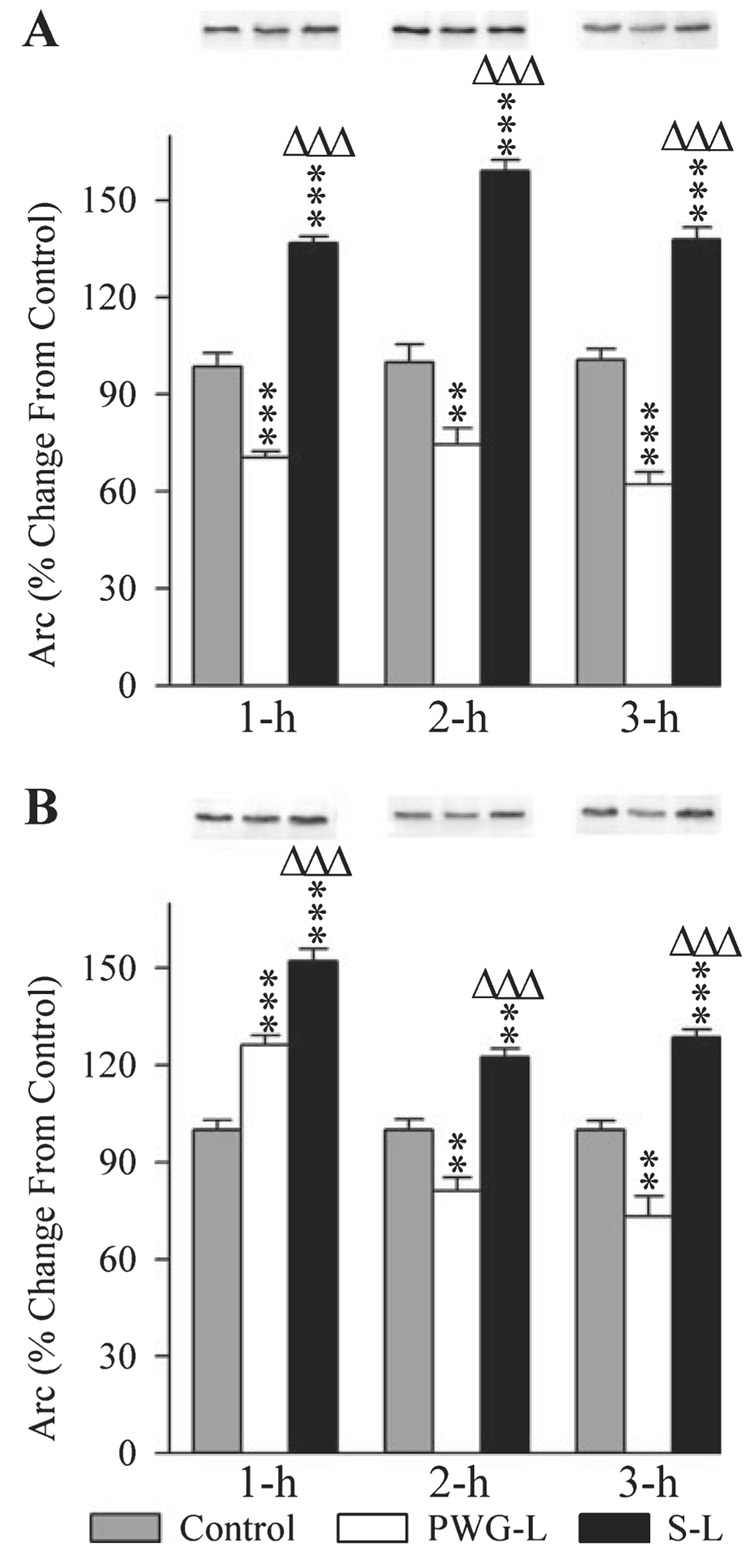
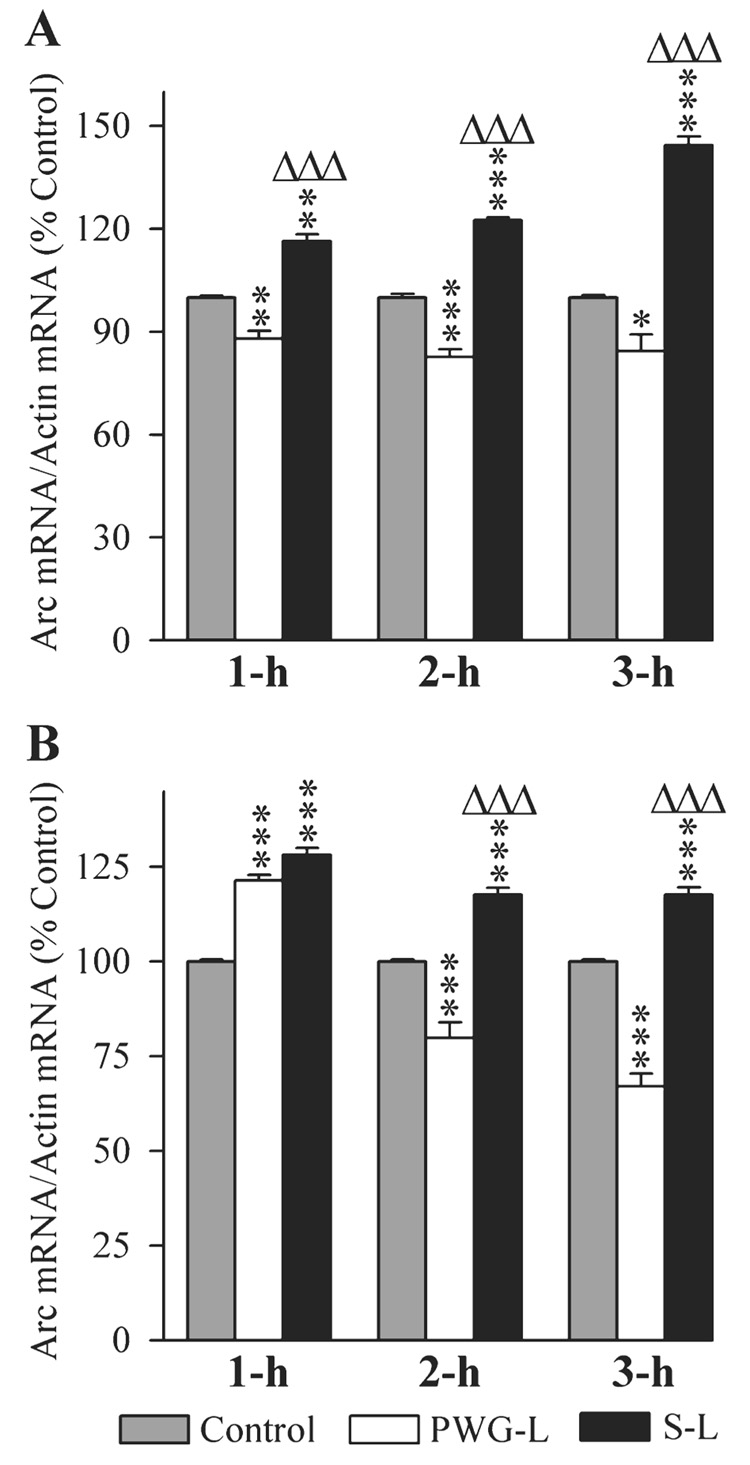
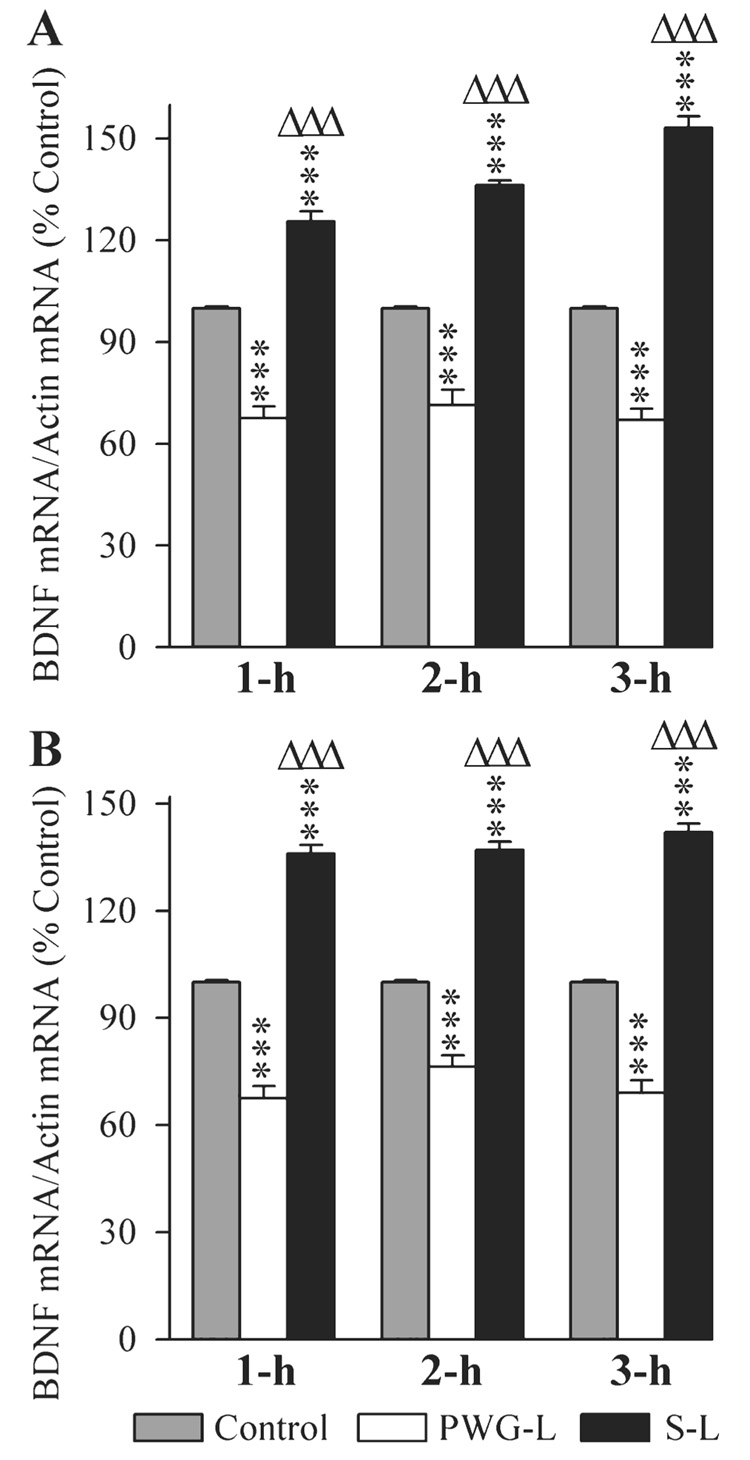
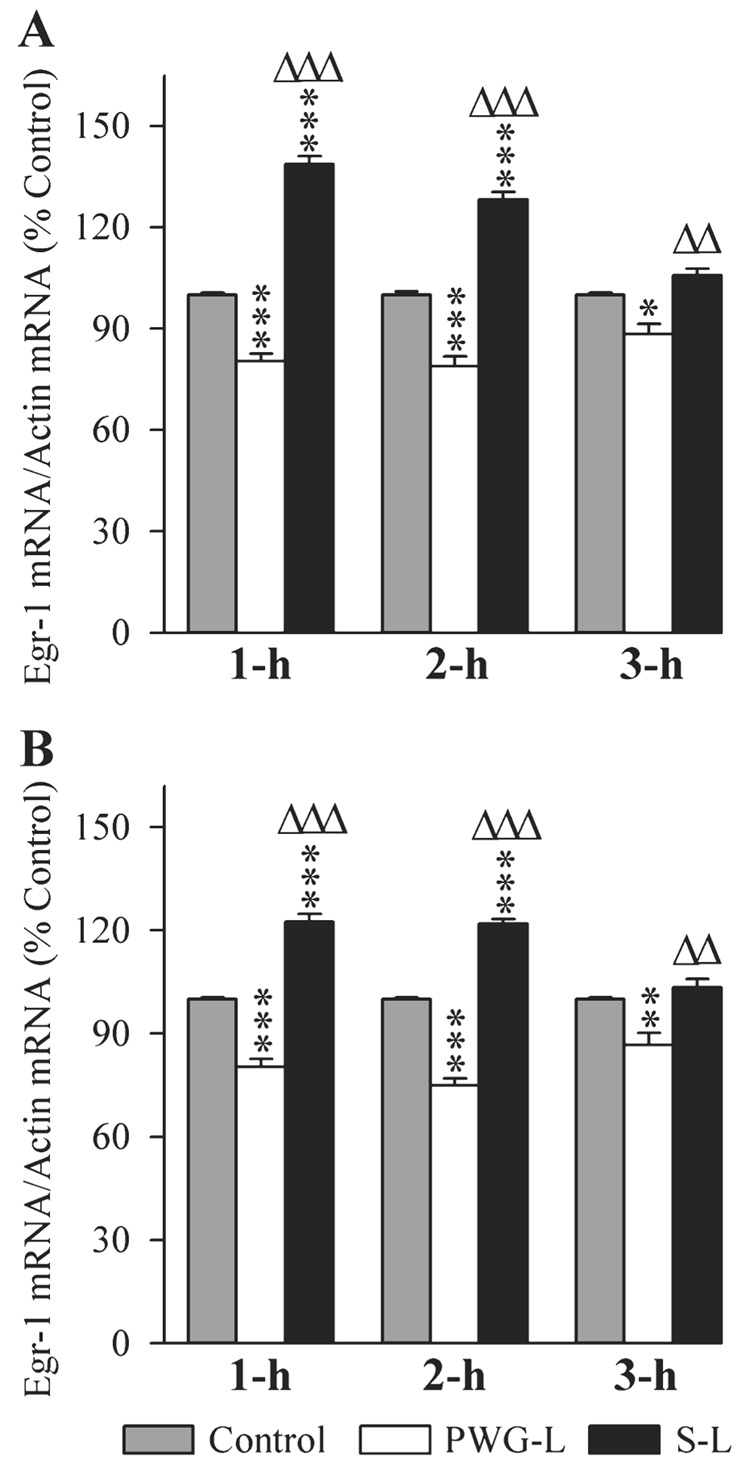
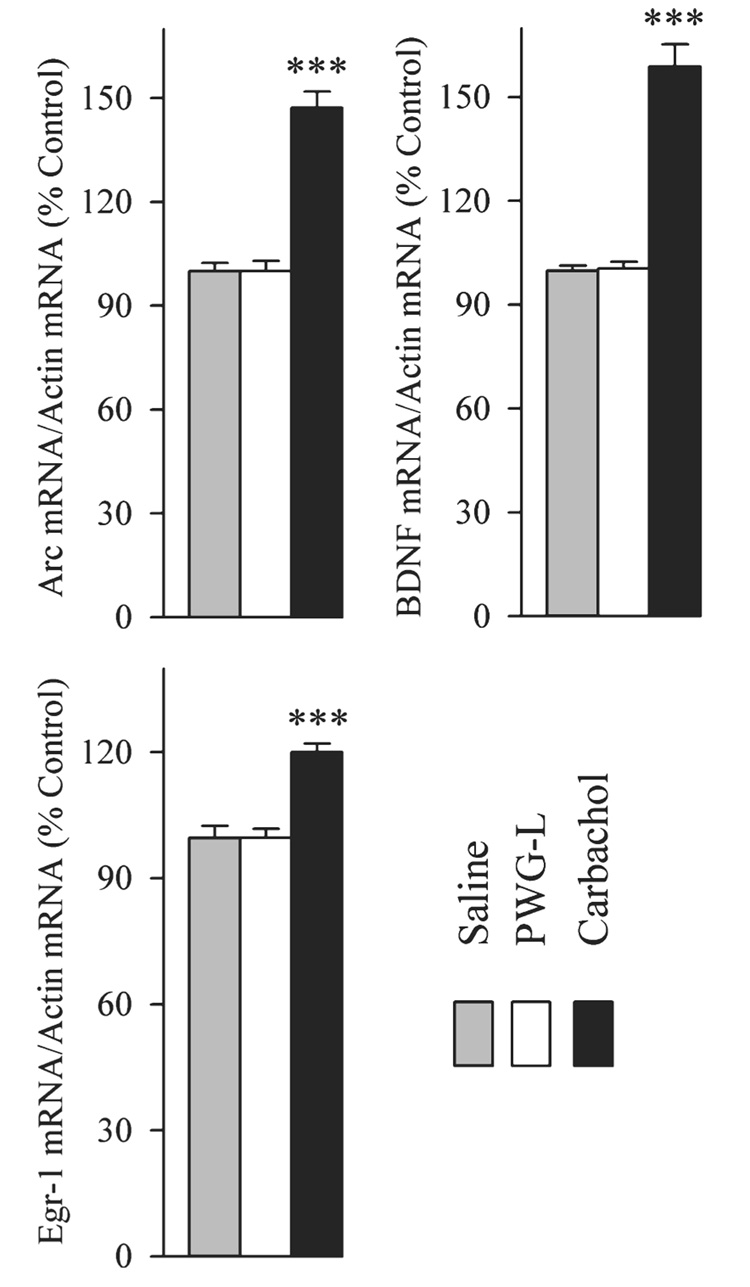
A number of behavioral studies have emphasized the importance of interactions between the pontine-wave (P-wave) generator and the dorsal hippocampus (DH) in two-way active avoidance (TWAA) memory processing; however, the direct involvement of the P-wave generator in the TWAA training trial-induced molecular events in the DH and amygdala has not been systematically evaluated. Here we demonstrate that the TWAA learning training trials activate P-wave generator, and increase phosphorylation of CREB (pCREB) and expression of activity-regulated cytoskeletal-associated (Arc) protein, as well as messenger ribonucleic acid (mRNAs) of Arc, brain-derived nerve growth factor (BDNF) and early growth response-1 (Egr-1) in the DH and amygdala. Selective elimination of P-wave-generating cells abolished P-wave activity and suppressed TWAA learning training trial-induced expression of pCREB and Arc proteins and Arc, BDNF and Egr-1 mRNAs in the DH and amygdala. Following a session of TWAA training, all rats were equal in terms of time spent in wakefulness, slow-wave sleep and rapid eye movement (REM) sleep irrespective of P-wave lesions. The second set of experiments demonstrated that localized cholinergic stimulation of the P-wave generator increased expression of Arc, BDNF and Egr-1 mRNAs in the DH. Together, these findings provide the first direct evidence that activation of P-wave-generating cells is critically involved in the TWAA training trial-induced expression of plasticity-related genes in the DH and amygdala. These findings are discussed in relation to the role of P-wave generator activation for the REM sleep-dependent development and cognitive functions of the brain.


Figures

FIG. 1
FIG. 1
Effects of pontine-wave (P-wave) generator lesion on the TWAA learning performance. Each bar represents mean and SE of number of avoidance (A), number of escape (B) and total shock time (C). On the X-axis: 1-h, group of animals killed 1 h after the end of TWAA training trials; 2-h, group of animals killed 2 h after the end of TWAA training trials; 3-h, group of animals killed 3 h after the end of TWAA training trials. Note that the number of avoidance, number of escape and total shock time are comparable (one-factor anova) between the S-L (black bars) and PWG-L (white bars) groups of animals. Also note that these variables are comparable between three subgroups (1 h, 2 h and 3 h; n = 6 rats / subgroup) of each group (S-L and PWG-L), indicating that all six subgroups (three subgroups of S-L and three subgroups of PWG-L) of rats were equal in terms of their ability to learn this TWAA training task.
FIG. 2
FIG. 2
Sample polygraphic appearance of REM sleep episode recorded in four different rats. (A) A REM sleep episode of a control rat recorded about 1.5 h after a session of control condition. (B) A REM sleep episode of a PWG-L rat recorded about 1.5 h after a session of TWAA training trials. (C) A REM sleep episode of a S-L rat recorded about 1.5 h after a session of TWAA training trials. (D) A REM sleep episode of a rat recorded about 45 min after a single microinjection of carbachol into the P-wave generator (CP group of rat, used in Experiment 2). Abbreviations: EEG, cortical electroencephalogram; H-EEG, hippocampal EEG; N-EMG, neck electromyogram; P-EEG, pontine EEG.
FIG. 3
FIG. 3
Effects of P-wave generator lesion and a session of TWAA training on the total percentages of W (A), SWS (B), rapid eye movement (REM) sleep (C), and REM sleep P-wave density (D). Bars represent the total percentages (mean and SE) of time spent in W, SWS, REM sleep, and REM sleep P-wave density of three different subgroups of rats (1 h, 2 h and 3 h) of control group after cage control (gray bars) and S-L (black bars) and PWG-L (white bars) groups after TWAA training trials. Note, compared with controls, a significant increase in REM sleep was present in both S-L and PWG-L groups. Also note that, compared with controls, P-wave density was higher in the S-L group. On the contrary, in the PWG-L group, P-wave density was significantly less compared with both control and S-L groups. Note that the P-wave density data are missing at the 1 h period (D) because during the first hour of recordings very few or no REM sleep episodes were present in the control group. Post hoc tests (Scheffe F-test): **P < 0.01 and ***P < 0.001, compared with control; ΔΔΔP < 0.001, compared with S-L.
FIG. 4
FIG. 4
Effects of P-wave generator lesion and a session of TWAA training on the cAMP response element-binding protein (CREB) expression in the DH (A) and amygdala (B). In Western blots, the first, second and third lanes represent levels of CREB in the brain extracts from control (gray bars), P-wave generator-lesioned (PWG-L; white bars) and sham-lesioned (S-L; black bars) animals, respectively. Representative blots of 1 h, 2 h and 3 h subgroups of control, PWG-L and S-L groups are placed directly above their mean densitometric bars. Data from densitometric analysis of Western blots are expressed as a percentage of control. Each bar represents the mean + SE of 1 h, 2 h, 3 h subgroups of control, PWG-L and S-L groups of animals (n = 6 rats / subgroup). Post hoc tests (Scheffe F-test): *P < 0.05, compared with control.
FIG. 5
FIG. 5
Effects of P-wave generator lesion and a session of TWAA training on the expression of phosphorylated CREB (pCREB) in the DH (A) and amygdala (B). In Western blots, the first, second and third lanes represent levels of pCREB in the brain extracts from control (gray bars), P-wave generator-lesioned (PWG-L; white bars) and sham-lesioned (S-L; black bars) animals, respectively. Representative blots of 1 h, 2 h and 3 h subgroups of control, PWG-L and S-L groups are placed directly above their mean densitometric bars. Data from densitometric analysis of Western blots are expressed as a percentage of control. Each bar represents the mean + SE of 1 h, 2 h, 3 h subgroups of control, PWG-L and S-L groups of animals (n = 6 rats/subgroup). Post hoc tests (Scheffe F-test): **P < 0.01 and ***P < 0.001, compared with control; ΔΔP < 0.01 and ΔΔΔP < 0.001, compared with S-L.
FIG. 6
FIG. 6
Effects of P-wave generator lesion and a session of TWAA training on the expression of activity-regulated cytoskeletal-associated protein (Arc) in the DH (A) and amygdala (B). In the Western blots, the first, second and third lanes represent levels of Arc in the brain extracts from control (gray bars), P-wave generator-lesioned (PWG-L; white bars) and sham-lesioned (S-L; black bars) animals, respectively. Representative blots of 1 h, 2 h and 3 h subgroups of control, PWG-L and S-L groups are placed exactly on the top of their mean densitometric bars. Data from densitometric analysis of Western blots are expressed as a percentage of control. Each bar represents the mean + SE of 1 h, 2 h, 3 h subgroups of control, PWG-L and S-L groups of animals (n = 6 rats/subgroup). Post hoc tests (Scheffe F-test): **P < 0.01 and ***P < 0.001, compared with control; ΔΔΔP < 0.001, compared with S-L.
FIG. 7
FIG. 7
Effects of P-wave generator lesion and a session of TWAA training on the expression of activity-regulated cytoskeletal-associated (Arc) mRNA in the DH (A) and amygdala (B). The levels of Arc and β-actin were measured by RT-PCR. The target gene mRNA level was normalized with the β-actin mRNA level. All data are expressed as percentage of control. Each bar represents the mean + SE of 1 h, 2 h, 3 h subgroups of control (gray bars), P-wave generator-lesioned (PWG-L; white bars) and sham-lesioned (S-L; black bars) groups of animals (n = 6 rats/subgroup). Post hoc tests (Scheffe F-test): *P < 0.05, **P < 0.01 and ***P < 0.001, compared with control; ΔΔΔP < 0.001, compared with S-L.
FIG. 8
FIG. 8
Effects of P-wave generator lesion and a session of TWAA training on the expression of brain-derived nerve growth factor (BDNF) mRNA in the DH (A) and amygdala (B). The levels of BDNF and β-actin were measured by RT-PCR. The target gene mRNA level was normalized with the β-actin mRNA level. All data are expressed as percentage of control. Each bar represents the mean + SE of 1 h, 2 h, 3 h subgroups of control (gray bars), P-wave generator-lesioned (PWG-L; white bars) and sham-lesioned (S-L; black bars) groups of animals (n = 6 rats/subgroup). Post hoc tests (Scheffe F-test): ***P < 0.001, compared with control; ΔΔΔP < 0.001, compared with S-L.
FIG. 9
FIG. 9
Effects of P-wave generator lesion and a session of TWAA training on the expression of early growth response 1 (Egr-1) mRNA in the DH (A) and amygdala (B). The levels of Egr-1 and β-actin were measured by RT-PCR. The target gene mRNA level was normalized with the β-actin mRNA level. All data are expressed as percentage of control. Each bar represents the mean + SE of 1 h, 2 h, 3 h subgroups of control (gray bars), P-wave generator-lesioned (PWG-L; white bars) and sham-lesioned (S-L; black bars) groups of animals (n = 6 rats/subgroup). Post hoc tests (Scheffe F-test): *P < 0.05, **P < 0.01, ***P < 0.001, compared with control; ΔΔP < 0.01, ΔΔΔP < 0.001, compared with S-L.
FIG. 10
FIG. 10
Effects of carbachol microinjection into the P-wave generator on the expression of activity-regulated cytoskeletal-associated (Arc), brain-derived nerve growth factor (BDNF) and early growth response 1 (Egr-1) mRNAs in the DH. The levels of Arc, BDNF, Egr-1 and β-actin were measured by RT-PCR. The target gene mRNA level was normalized with the β-actin mRNA level. All data are expressed as percentage of control (‘Saline’, control saline microinjection into the P-wave generator). Each bar represents the mean + SE of control (gray bars), P-wave generator-lesioned (PWG-L, introduction of microinjector into the guide tube but no injection; white bars) and carbachol-microinjected (Carbachol; black bars) groups of animals (n = 6 rats/group). Post hoc Scheffe F-test (compared with control, saline), ***P < 0.001.

Similar articles

Cited by

References

    1. Agassandian K, Gedney M, Cassel MD. Neurotrophic factors in the central nucleus of amygdala may be organized to provide substrates for associative learning. Brain Res. 2006;1076:780–786. - PubMed
    1. Alonso M, Bekinschtein P, Cammarota M, Vianna MR, Izquierdo I, Medina JH. Endogenous BDNF is required for long-term memory formation in the rat parietal cortex. Learn. Mem. 2005;12:504–510. - PMC - PubMed
    1. Athos J, Impey S, Pineda VV, Chen X, Storm DR. Hippocampal CRE-mediated gene expression is required for contextual memory formation. Nat. Neurosci. 2002;5:1119–1120. - PubMed
    1. Bailey DJ, Kim JJ, Sun W, Thompson RF, Helmstetter FJ. Acquisition of fear conditioning in rats requires the synthesis of mRNA in the amygdala. Behav. Neurosci. 1999;11:276–282. - PubMed
    1. Bernabeu R, Bevilaqua L, Ardenghi P, Bromberg E, Schmitz P, Bianchin M, Izquierdo I, Medina JH. Involvement of hippocampal cAMP/cAMP-dependent protein kinase signaling pathways in a late memory consolidation phase of aversively motivated learning in rats. Proc. Natl Acad. Sci. USA. 1997;94:7041–7046. - PMC - PubMed

Publication types

MeSH terms

Substances