

doi: 10.1111/j.1365-2141.2008.07135.x.
Epub 2008 Mar 26.
Vitamin D deficiency, cardiac iron and cardiac function in thalassaemia major
Affiliations
- PMID: 18371108
- PMCID: PMC2892922
- DOI: 10.1111/j.1365-2141.2008.07135.x
Item in Clipboard
Vitamin D deficiency, cardiac iron and cardiac function in thalassaemia major
Br J Haematol.
2008 Jun.
Abstract
Vitamin D25-OH and D1-25OH levels were compared with cardiac R2* (1/T2*), left ventricular ejection fraction (LVEF), age, ferritin and liver iron in 24 thalassaemia major patients. Vitamin D25-OH levels were reduced in 13/24 patients while vitamin D1-25OH levels were often elevated. Vitamin D25-OH levels decreased with age (r(2) = 0.48) and with liver iron (r(2) = 0.20). Cardiac R2* was inversely related with the ratio of D25-OH to D1-25OH levels (r(2) = 0.42). LVEF was also proportional to the D25-OH/D1-25OH ratio (r(2) = 0.49). Vitamin D deficiency may be associated with cardiac iron uptake and ventricular dysfunction in thalassaemia major patients.
Figures
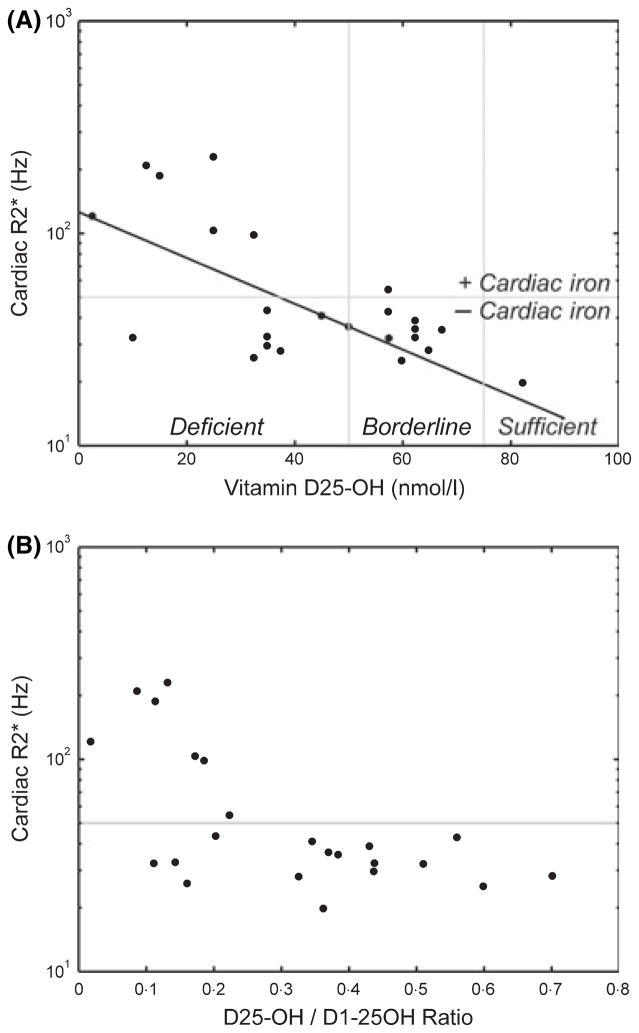
(A) Plot of cardiac R2★ as a function of vitamin D25-OH levels. Cardiac R2★ is proportional to cardiac iron. Vertical scale is logarithmic; cardiac R2★ >50 Hz (shown by the horizontal grey line) indicates the threshold for detectable cardiac iron, corresponding to a T2★ of less than 20 ms. Log-linear correlation has a negative slope with a r2 of 0·44. Vitamin D25-OH levels of 50 nmol/l (vertical line) represents the lower limit of normal and 75 nmol/l indicates vitamin D ‘sufficiency’ (Dawson-Hughes et al, 2005). (B) Corresponding plot demonstrating the ratio of D25-OH to D1-25OH levels. A ratio less than 0·25 is associated with a sharp increase in detectable cardiac iron.
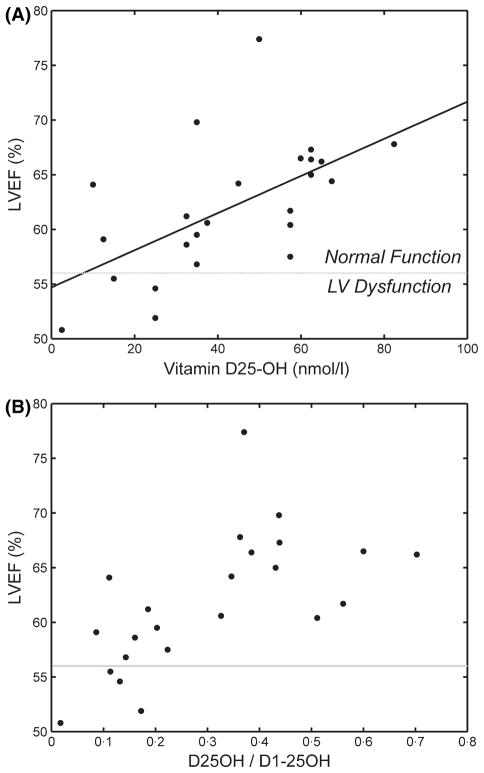
(A) Plot of left ventricular ejection fraction (LVEF) measured by MRI as a function of vitamin D25-OH levels. LVEF of 56% (shown by the horizontal grey line) indicates the threshold abnormal ejection fraction for non-iron overloaded thalassaemia major patients at our institution. Linear correlation has a positive slope with r2 of 0·35. (B) Corresponding plot demonstrating the ratio of D25-OH to D1-25OH levels. All patients with LV dysfunction had a ratio less than 0·2.
References
-
- Bhattacharya SK, Ahokas RA, Carbone LD, Newman KP, Gerling IC, Sun Y, Weber KT. Macro- and micronutrients in African-Americans with heart failure. Heart Failure Reviews. 2006;11:45–55. - PubMed
-
- Billaudel BJ, Delbancut AP, Sutter BC, Faure AG. Stimulatory effect of 1,25-dihydroxyvitamin D3 on calcium handling and insulin secretion by islets from vitamin D3-deficient rats. Steroids. 1993;58:335–341. - PubMed
-
- Chapuy MC, Preziosi P, Maamer M, Arnaud S, Galan P, Hercberg S, Meunier PJ. Prevalence of vitamin D insufficiency in an adult normal population. Osteoporosis International. 1997;7:439–443. - PubMed
-
- Chiu KC, Chu A, Go VL, Saad MF. Hypovitaminosis D is associated with insulin resistance and beta cell dysfunction. American Journal of Clinical Nutrition. 2004;79:820–825. - PubMed
-
- Chow LH, Frei JV, Hodsman AB, Valberg LS. Low serum 25-hydroxyvitamin D in hereditary hemochromatosis: relation to iron status. Gastroenterology. 1985;88:865–869. - PubMed
Publication types
MeSH terms
Substances
Grants and funding
LinkOut - more resources
Full Text Sources
Medical
