

Amoeboid microglia in the periventricular white matter induce oligodendrocyte damage through expression of proinflammatory cytokines via MAP kinase signaling pathway in hypoxic neonatal rats
- PMID: 18371179
- PMCID: PMC8095524
- DOI: 10.1111/j.1750-3639.2008.00138.x
Amoeboid microglia in the periventricular white matter induce oligodendrocyte damage through expression of proinflammatory cytokines via MAP kinase signaling pathway in hypoxic neonatal rats
Abstract
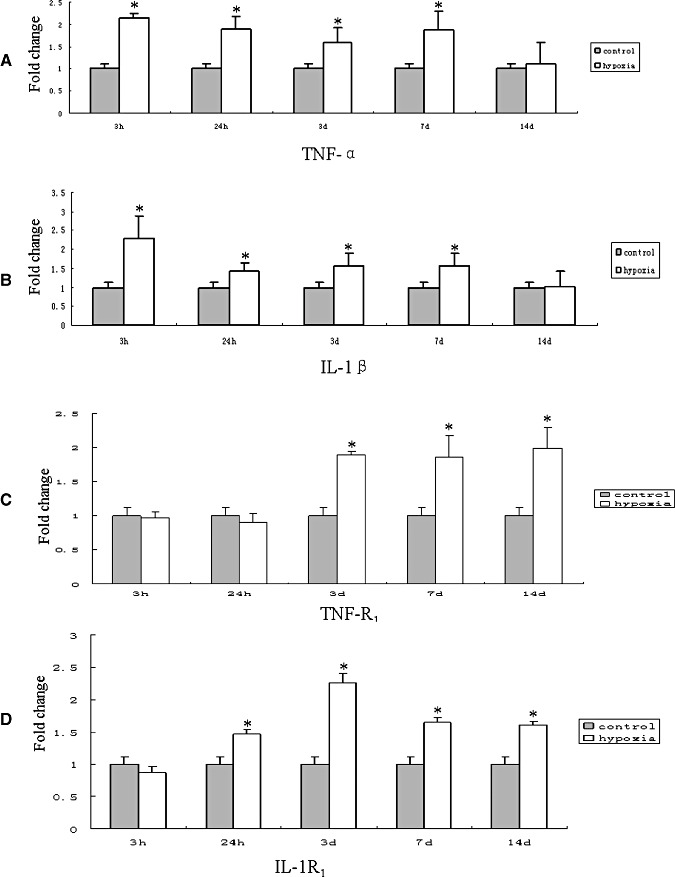
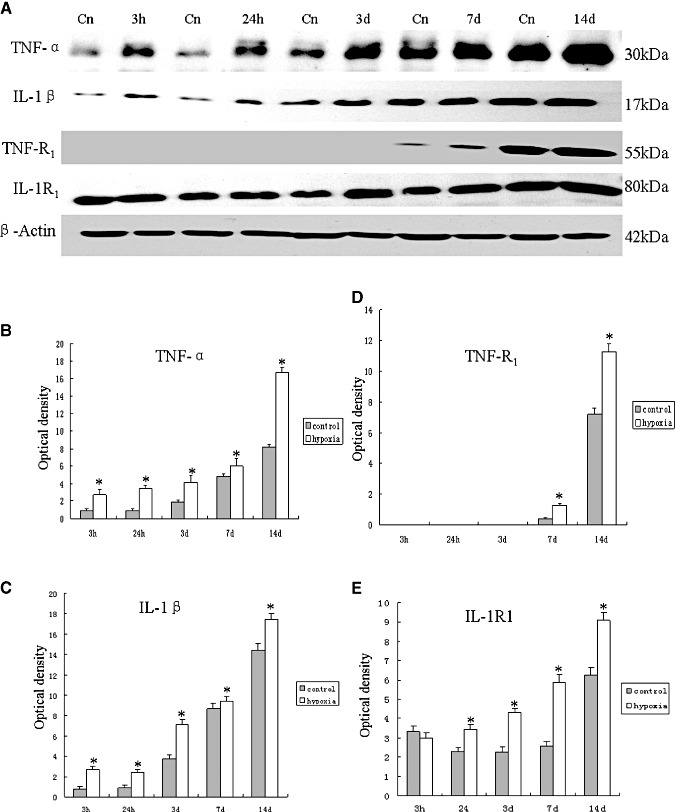
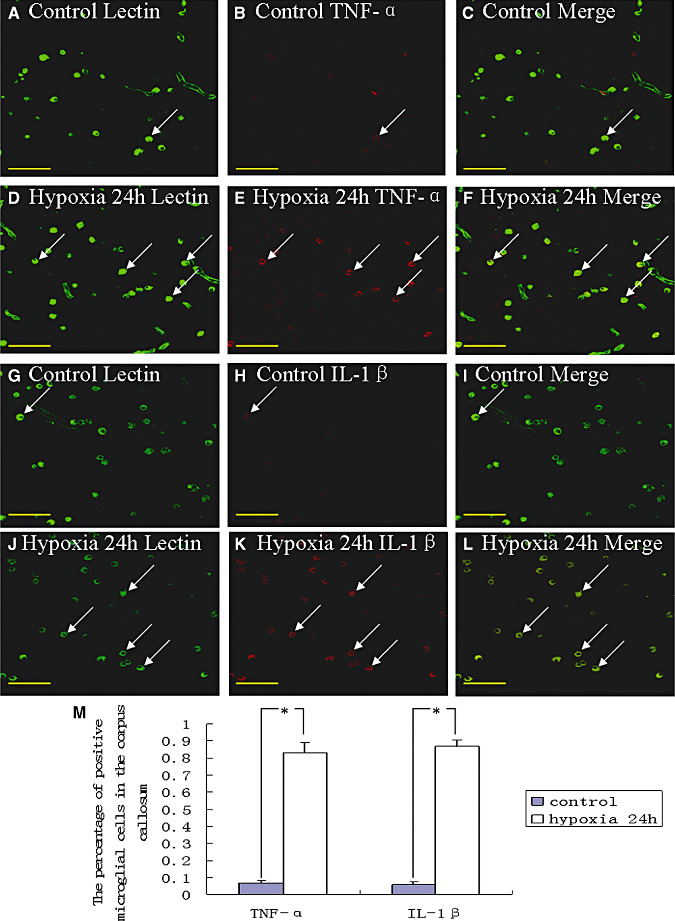
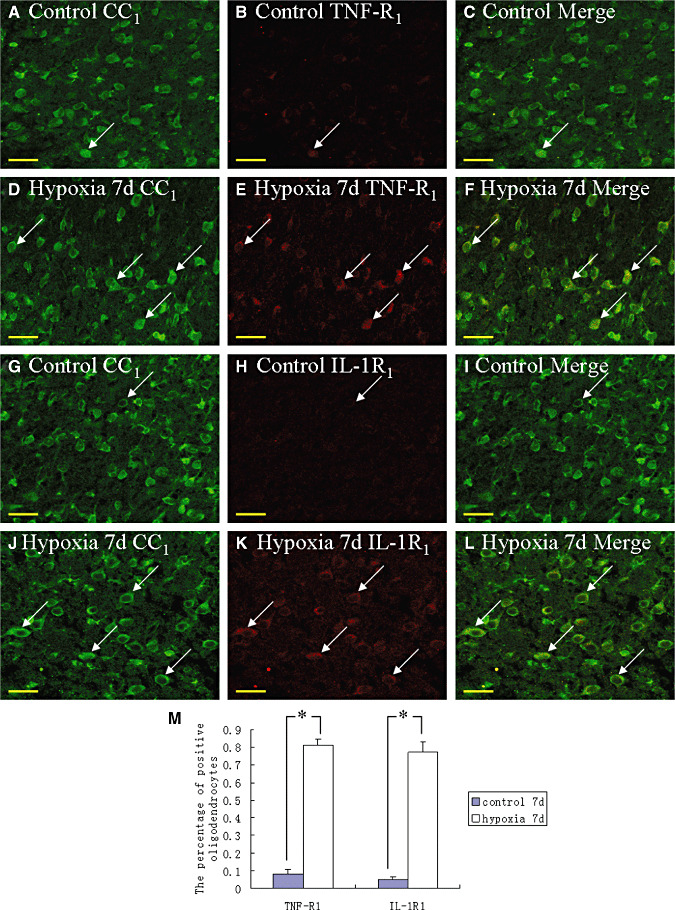
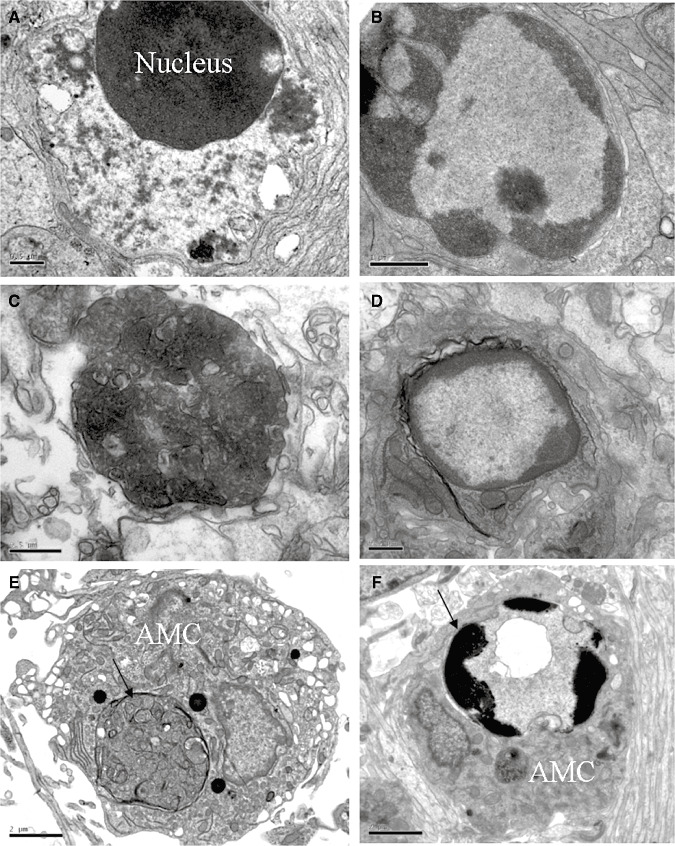
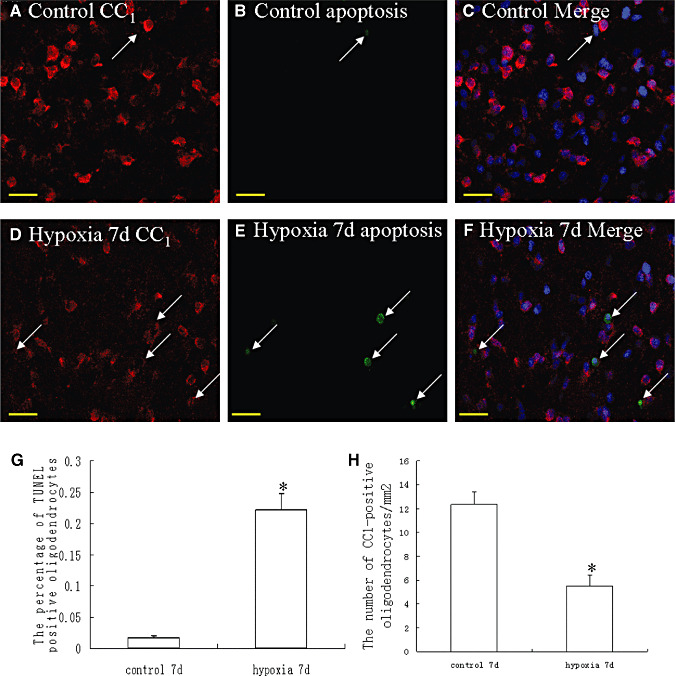
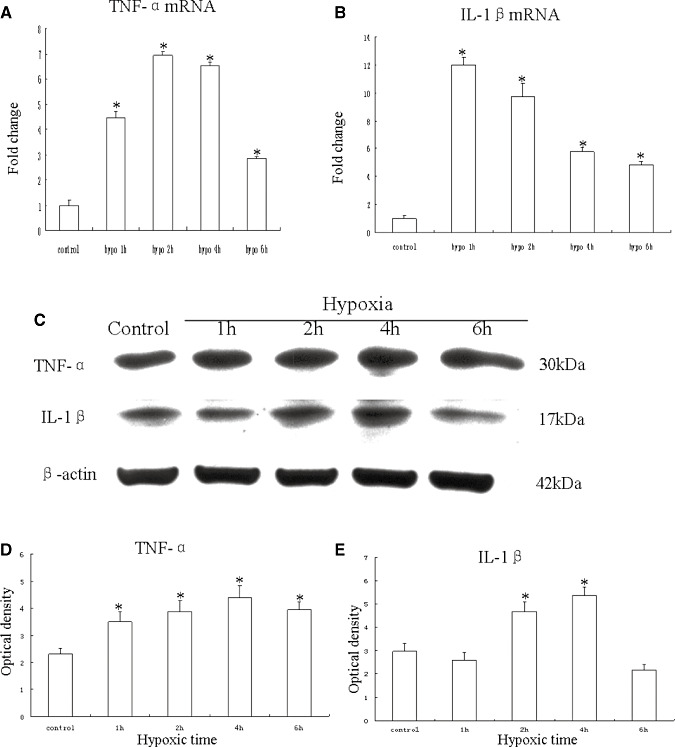
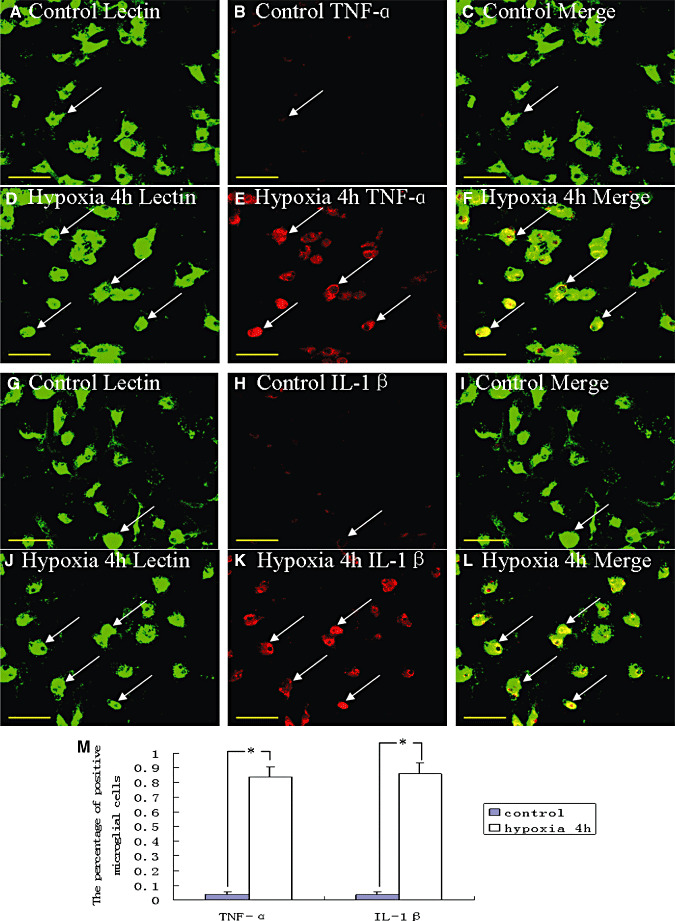
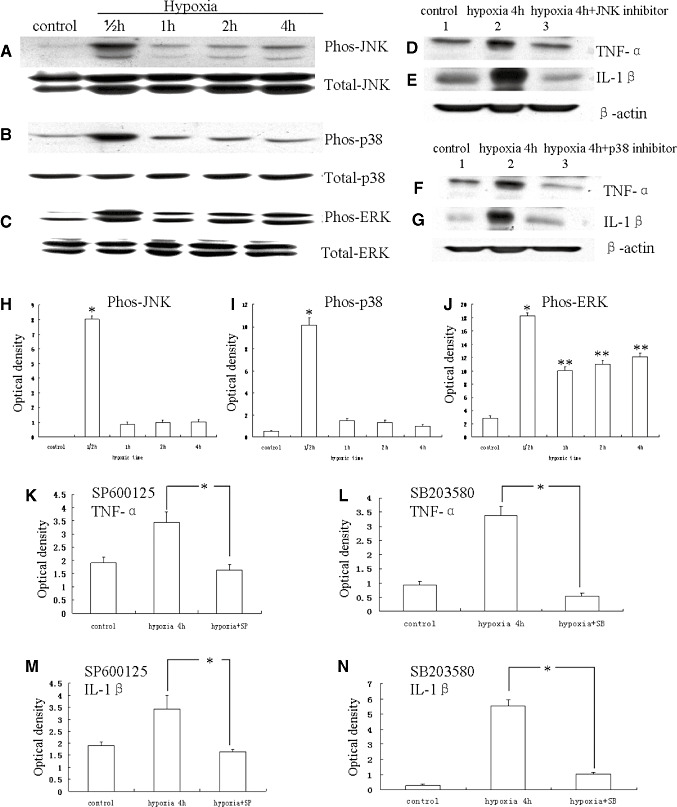
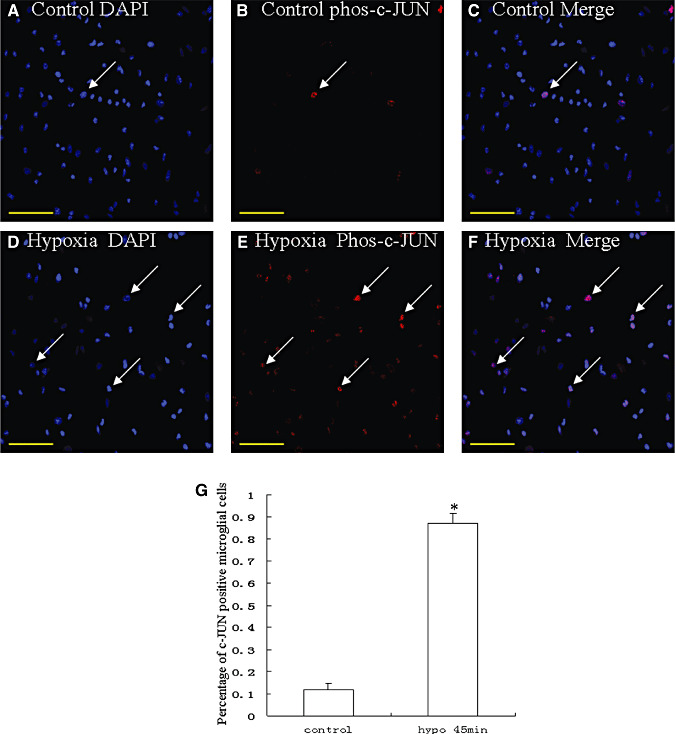
Hypoxic injury in the perinatal period results in periventricular white matter (PWM) lesions with axonal damage and oligodendroglial loss. It also alters macrophage function by perpetuating expression of inflammatory mediators. Relevant to this is the preponderance of amoeboid microglial cells (AMC) characterized as active macrophages in the developing PWM. This study aimed to determine if AMC produce proinflammatory cytokines that may be linked to the oligodendroglial loss observed in hypoxic PWM damage (PWMD). Wistar rats (1 day old) were subjected to hypoxia, following which upregulated expression of tumor necrosis factor-alpha (TNF-alpha), interleukin-1beta (IL-1beta), TNF receptor 1 (TNF-R(1)) and IL-1 receptor 1 (IL-1R(1)) was observed. This was coupled with apoptosis and expression of TNF-R(1) and IL-1R(1) in oligodendrocytes. Primary cultured microglial cells subjected to hypoxia (3% oxygen, 5% CO(2) and 92% nitrogen) showed enhanced expression of TNF-alpha and IL-1beta. Furthermore, mitogen-activated protein (MAP) kinase signaling pathway was involved in the expression of TNF-alpha and IL-1beta in microglia subjected to hypoxia. Our results suggest that following a hypoxic insult, microglial cells in the neonatal rats produce inflammatory cytokines such as TNF-alpha and IL-1beta via MAP kinase signaling pathway. These cytokines are detrimental to oligodendrocytes resulting in PWM lesion.
Figures
Similar articles
-
Expression of N-methyl D-aspartate receptor subunits in amoeboid microglia mediates production of nitric oxide via NF-κB signaling pathway and oligodendrocyte cell death in hypoxic postnatal rats.Glia. 2011 Apr;59(4):521-39. doi: 10.1002/glia.21121. Epub 2011 Jan 6. Glia. 2011. PMID: 21319220
-
Astrocyte-derived proinflammatory cytokines induce hypomyelination in the periventricular white matter in the hypoxic neonatal brain.PLoS One. 2014 Jan 31;9(1):e87420. doi: 10.1371/journal.pone.0087420. eCollection 2014. PLoS One. 2014. PMID: 24498101 Free PMC article.
-
Microglia-derived macrophage colony stimulating factor promotes generation of proinflammatory cytokines by astrocytes in the periventricular white matter in the hypoxic neonatal brain.Brain Pathol. 2010 Sep;20(5):909-25. doi: 10.1111/j.1750-3639.2010.00387.x. Epub 2010 Mar 9. Brain Pathol. 2010. PMID: 20406232 Free PMC article.
-
Roles of activated microglia in hypoxia induced neuroinflammation in the developing brain and the retina.J Neuroimmune Pharmacol. 2013 Mar;8(1):66-78. doi: 10.1007/s11481-012-9347-2. Epub 2012 Feb 26. J Neuroimmune Pharmacol. 2013. PMID: 22367679 Review.
-
Role of microglia in the process of inflammation in the hypoxic developing brain.Front Biosci (Schol Ed). 2011 Jun 1;3(3):884-900. doi: 10.2741/194. Front Biosci (Schol Ed). 2011. PMID: 21622239 Review.
Cited by
-
Cardiotonic pill attenuates white matter and hippocampal damage via inhibiting microglial activation and downregulating ERK and p38 MAPK signaling in chronic cerebral hypoperfused rat.BMC Complement Altern Med. 2013 Nov 26;13:334. doi: 10.1186/1472-6882-13-334. BMC Complement Altern Med. 2013. PMID: 24274593 Free PMC article.
-
Prenatal Hyperhomocysteinemia Induces Glial Activation and Alters Neuroinflammatory Marker Expression in Infant Rat Hippocampus.Cells. 2021 Jun 18;10(6):1536. doi: 10.3390/cells10061536. Cells. 2021. PMID: 34207057 Free PMC article.
-
Plasma Tumor Necrosis Factor-alpha (TNF-α) Levels Correlate with Disease Severity in Spastic Diplegia, Triplegia, and Quadriplegia in Children with Cerebral Palsy.Med Sci Monit. 2015 Dec 11;21:3868-74. doi: 10.12659/msm.895400. Med Sci Monit. 2015. PMID: 26656070 Free PMC article.
-
The Hallmarks of Ageing in Microglia.Cell Mol Neurobiol. 2025 May 19;45(1):45. doi: 10.1007/s10571-025-01564-y. Cell Mol Neurobiol. 2025. PMID: 40389766 Free PMC article. Review.
-
Unveiling of miRNA Expression Patterns in Purkinje Cells During Development.Cerebellum. 2017 Apr;16(2):376-387. doi: 10.1007/s12311-016-0814-9. Cerebellum. 2017. PMID: 27387430
References
-
- Arnett HA, Mason J, Marino M, Suzuki K, Matsushima GK, Ting JP (2001) TNF alpha promotes proliferation of oligodendrocyte progenitors and remyelination. Nat Neurosci 4:1116–1122. - PubMed
-
- Bhat NR, Zhang P, Lee JC, Hogan EL (1998) Extracellular signal‐regulated kinase and p38 subgroups of mitogen‐activated protein kinases regulate inducible nitric oxide synthase and tumor necrosis factor‐alpha gene expression in endotoxin‐stimulated primary glial cultures. J Neurosci 18:1633–1641. - PMC - PubMed
-
- Bohatschek M, Kloss CU, Hristova M, Pfeffer K, Raivich G (2004) Microglial major histocompatibility complex glycoprotein‐1 in the axotomized facial motor nucleus: regulation and role of tumor necrosis factor receptors 1 and 2. J Comp Neurol 470:382–399. - PubMed
-
- Bradford MM (1976) A rapid and sensitive method for the quantitation of microgram quantities of protein utilizing the principle of protein‐dye binding. Anal Biochem 72:248–254. - PubMed
-
- Carloni S, Mazzoni E, Cimino M, De Simoni MG, Perego C, Scopa C, Balduini W (2006) Simvastatin reduces caspase‐3 activation and inflammatory markers induced by hypoxia‐ischemia in the newborn rat. Neurobiol Dis 21:119–126. - PubMed
Publication types
MeSH terms
Substances
LinkOut - more resources
Full Text Sources
