. 2008 Jul;18(3):326-37.
doi: 10.1111/j.1750-3639.2008.00122.x. Epub 2008 Mar 26.

Comprehensive characterization of genomic aberrations in gangliogliomas by CGH, array-based CGH and interphase FISH

Affiliations

Comprehensive characterization of genomic aberrations in gangliogliomas by CGH, array-based CGH and interphase FISH

Alexander Hoischen et al. Brain Pathol. 2008 Jul.

Abstract

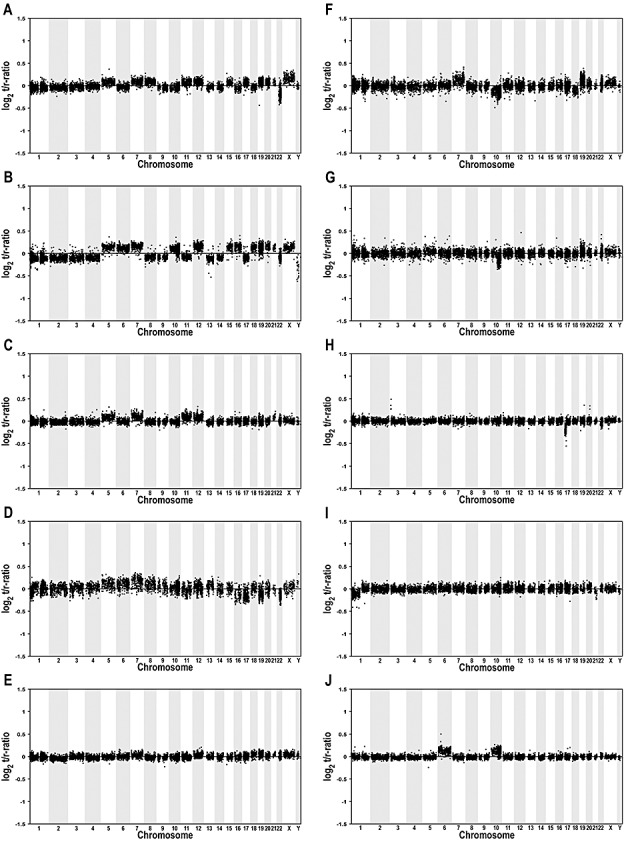
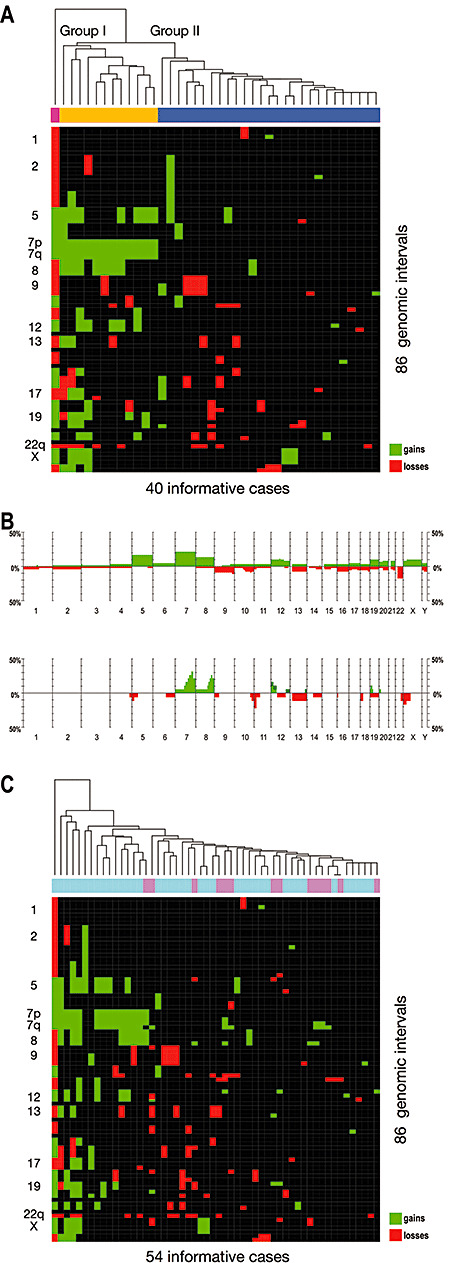
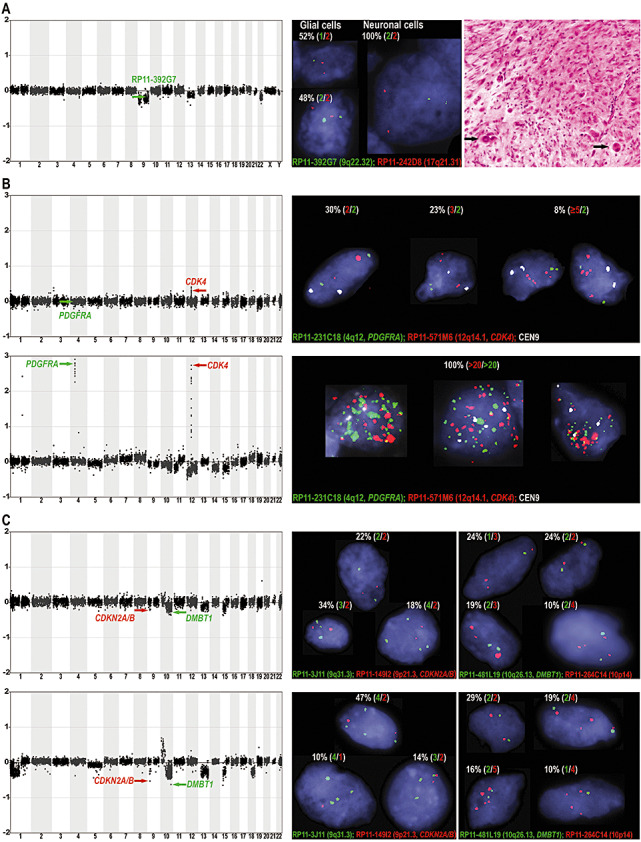
Gangliogliomas are generally benign neuroepithelial tumors composed of dysplastic neuronal and neoplastic glial elements. We screened 61 gangliogliomas [World Health Organization (WHO) grade I] for genomic alterations by chromosomal and array-based comparative genomic hybridization (CGH). Aberrations were detected in 66% of gangliogliomas (mean +/- SEM = 2.5 +/- 0.5 alterations/tumor). Frequent gains were on chromosomes 7 (21%), 5 (16%), 8 (13%), 12 (12%); frequent losses on 22q (16%), 9 (10%), 10 (8%). Recurrent partial imbalances comprised the minimal overlapping regions dim(10)(q25) and enh(12)(q13.3-q14.1). Unsupervised cluster analysis of genomic profiles detected two major subgroups (group I: complete gain of 7 and additional gains of 5, 8 or 12; group II: no major recurring imbalances, mainly losses). A comparison with low-grade gliomas (astrocytomas WHO grade II) showed chromosome 5 gain to be significantly more frequent in gangliogliomas. Interphase fluorescence in situ hybridization (FISH) identified the aberrations to be contained in a subpopulation of glial but not in neuronal cells. Two gangliogliomas and their anaplastic recurrences (WHO grade III) were analyzed. Losses of CDKN2A/B and DMBT1 or a gain/amplification of CDK4 found in the anaplastic tumors were already present in the respective gangliogliomas by array CGH and interphase FISH. In summary, genomic profiling in a large series of gangliogliomas could distinguish genetic subgroups even in this low-grade tumor.


Figures

Figure 1
Figure 1
Summary of imbalances detected by comparative genomic hybridization (CGH) analysis of 61 gangliogliomas (WHO grade I). Alterations found by chromosomal CGH are depicted as continuous lines, array CGH findings are shown as dashed lines. Lines to the right of each chromosome ideogram indicate gains, and lines to the left of an ideogram represent losses.
Figure 2
Figure 2
Array comparative genomic hybridization (CGH) profiles of 10 selected gangliogliomas (WHO grade I). Midpoints of all clones are plotted in genomic order from 1p to Yq on the x‐axis against their normalized log2 test to reference ratio on the y‐axis. Vertical bars indicate clones belonging to the same chromosome. The following tumors are shown: A: 52, B: 53, C: 56, D: 50, E: 58, F: 59, G: 54, H: 44, I: 43, J: 45. Note that tumor profiles shown in A–F show gains of chromosome 7 in combination with gains of chromosomes 5, 8, 12 and/or 19 (Table 1).
Figure 3
Figure 3
Molecular subclassification of gangliogliomas (WHO grade I) by their genomic signature and comparison of genetic profiles in gangliogliomas and diffuse astrocytomas (WHO grade II). A. Unsupervised cluster analysis of the gangliogliomas showing imbalances in comparative genomic hybridization analysis (40 of 61 cases). A separation of cases into two major groups is apparent, with gains of the whole chromosome 7 being the defining feature of group I (coded yellow). Group II (coded blue) does not exhibit major recurring imbalances, with the exception of losses on chromosomes 9 and 22, which are, however, not exclusive to the group. Interestingly, gain of chromosome 7 appears to be related to a variety of other chromosomal gains (eg, of 5, 8, 12, 19), which can also be found in one highly aberrant case not assigned to the two main clusters (coded magenta). B. Histograms comparing the frequency of genomic gains (green bars showing upwards) and losses (red bars showing downwards) in 61 gangliogliomas of WHO grade I (top) and 19 diffuse astrocytomas of WHO grade II (bottom). While mostly the same chromosomes are affected in both tumor entities, the majority of imbalances involve whole chromosomes in gangliogliomas vs. parts of chromosomes in diffuse astrocytomas. Gain of chromosome 5 was the only imbalance found significantly more frequently in gangliogliomas. C. Unsupervised cluster analysis of 40 gangliogliomas of WHO grade I (coded light blue) and 14 diffuse astrocytomas of WHO grade II (coded pink). While a subgroup of gangliogliomas largely corresponding to ganglioglioma cluster group I (compare A) exhibits a concordant pattern of genomic imbalances, the diffuse astrocytomas form small subclusters defined by single regional aberrations (eg, gains on 7q) within ganglioglioma cluster group II (compare A).
Figure 4
Figure 4
Analysis of tumor DNA by array comparative genomic hybridization (CGH) and tissue sections by interphase fluorescence in situ hybridization (FISH). A. Array CGH profile (left), interphase FISH analysis (center) and hematoxylin and eosin staining (right) of ganglioglioma No. 46 exhibiting the typical composition of dysplastic neuronal and astroglial elements; note the large dysplastic, occasionally binucleated neuronal cells (right, black arrows). The array CGH profile showed losses of chromosomes 9, 13q and 22q (left). By interphase FISH, losses of clones on 9 (green arrow in array CGH profile) and on 22q (not shown) were verified and the cell component harboring the imbalances was identified. Interphase FISH showed only one signal for clone RP11‐392G7 (9q22.32) in 52% of glial cells corresponding to a deletion of one copy, but two signals in all neuronal cells indicating a normal diploid pattern (center). For clone CTA‐229A8 (22q13), one signal was found in 38% of glial cells, whereas all neuronal cells showed two signals (data not shown). Thus, the imbalances were only detected in a subpopulation of glial and not in neuronal cells. B. Array CGH and interphase FISH analysis of ganglioglioma No. 60 (WHO grade I, upper panels) recurring as an anaplastic ganglioglioma (WHO grade III, lower panels) in the same patient. In the anaplastic ganglioglioma, array CGH detected amplifications of clones containing the oncogenes PDGFRA (RP11‐231C18, 4q12, green arrow) and CDK4 (RP11‐571M6, 12q14.1, red arrow). By interphase FISH, more than 20 copies were found for both clones in all tumor cells, whereas a control probe (CEN9) was present in up to four copies corresponding to a near tetraploid karyotype. In the ganglioglioma, array CGH detected no alteration of RP11‐231C18 (PDGFRA), while RP11‐571M6 (CDK4) showed a subtle gain at 12q14.1 not identified in any other ganglioglioma. By interphase FISH, over 30% of cells showed more than two signals for RP11‐571M6 (CDK4), whereas only 30% of cells had a normal diploid pattern (ie, two signals for all probes used). C. Array CGH and interphase FISH analysis of ganglioglioma No. 61 (WHO grade I, upper panels) recurring as an anaplastic ganglioglioma (WHO grade III, lower panels) in the same patient. In the anaplastic ganglioglioma, array CGH identified prominent losses for clones RP11‐149I2 (CDKN2A/B, 9p21.3) and RP11‐481L19 (DMBT1, 10q26.13). By interphase FISH, a pattern of three to four signals for control probes and one to two signals for RP11‐149I2 (CDKN2A/B) and RP11‐481L19 (DMBT1) were found in over 70% of cells, corresponding to a relative loss of the clones containing these tumor suppressor genes. In the ganglioglioma, the same clones showed a diminished ratio by array CGH making this the only ganglioglioma with combined CDKN2A/B and DMBT1 losses. Interphase FISH showed that on a cellular level the alterations were relative losses (one to two signals) compared with control probes present in three to four signals (near triploid to tetraploid karyotype) in around 50% of cells.

Similar articles

Cited by

References

    1. Baudis M (2006) Online database and bioinformatics toolbox to support data mining in cancer cytogenetics. Biotechniques 40:269–270, 272. - PubMed
    1. Baudis M, Cleary ML (2001) Progenetix.net: an online repository for molecular cytogenetic aberration data. Bioinformatics 17:1228–1229. - PubMed
    1. Becker AJ, Lobach M, Klein H, Normann S, Nothen MM, Von Deimling A et al (2001) Mutational analysis of TSC1 and TSC2 genes in gangliogliomas. Neuropathol Appl Neurobiol 27:105–114. - PubMed
    1. Becker AJ, Klein H, Baden T, Aigner L, Normann S, Elger CE et al (2002) Mutational and expression analysis of the reelin pathway components CDK5 and doublecortin in gangliogliomas. Acta Neuropathol (Berl) 104:403–408. - PubMed
    1. Becker AJ, Blumcke I, Urbach H, Hans V, Majores M (2006) Molecular neuropathology of epilepsy‐associated glioneuronal malformations. J Neuropathol Exp Neurol 65:99–108. - PubMed

Publication types