

Predicting cancer involvement of genes from heterogeneous data
- PMID: 18371197
- PMCID: PMC2330045
- DOI: 10.1186/1471-2105-9-172
Predicting cancer involvement of genes from heterogeneous data
Abstract
Background: Systematic approaches for identifying proteins involved in different types of cancer are needed. Experimental techniques such as microarrays are being used to characterize cancer, but validating their results can be a laborious task. Computational approaches are used to prioritize between genes putatively involved in cancer, usually based on further analyzing experimental data.
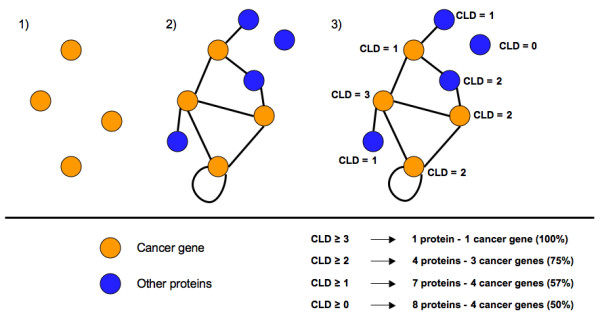
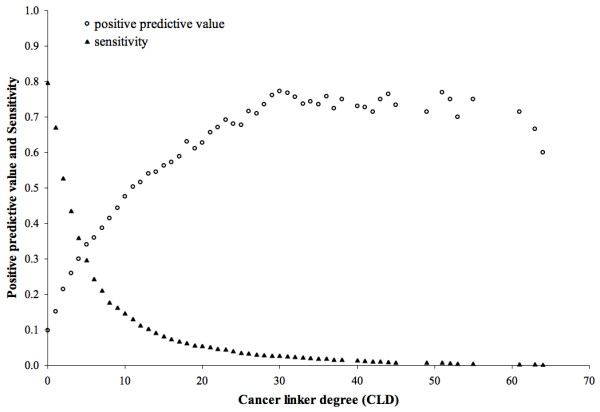
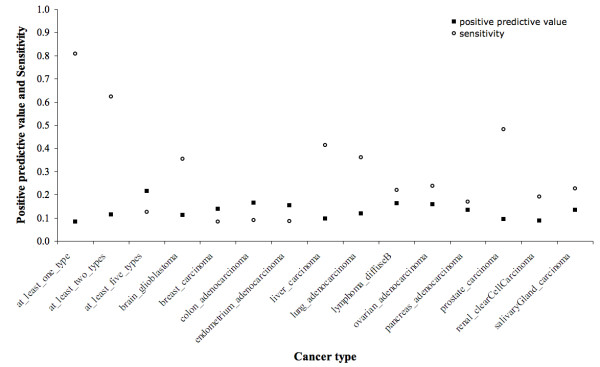
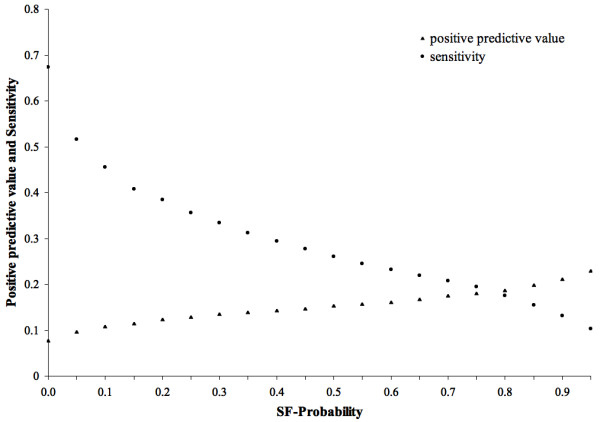
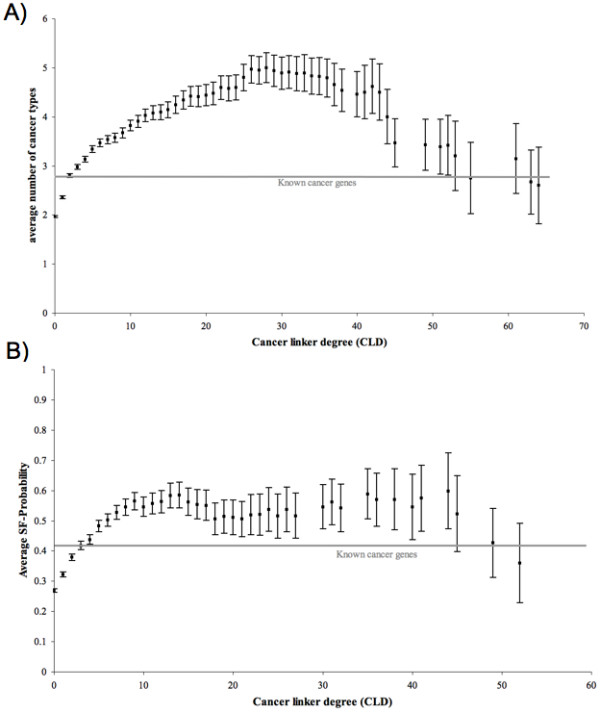
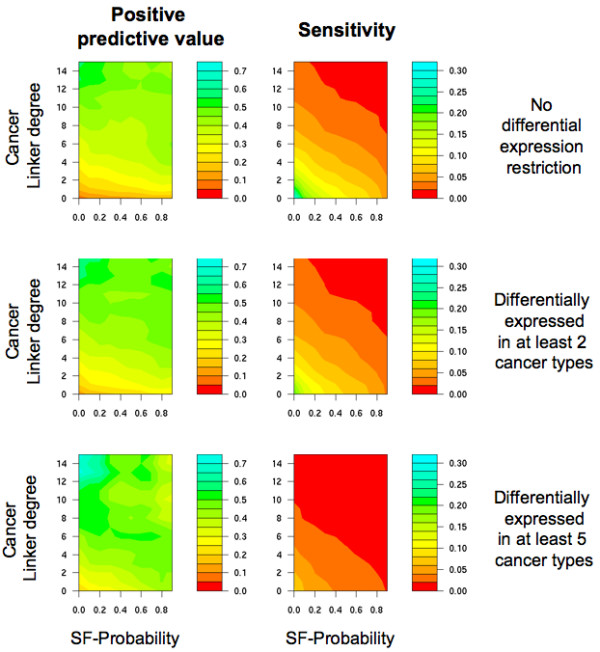
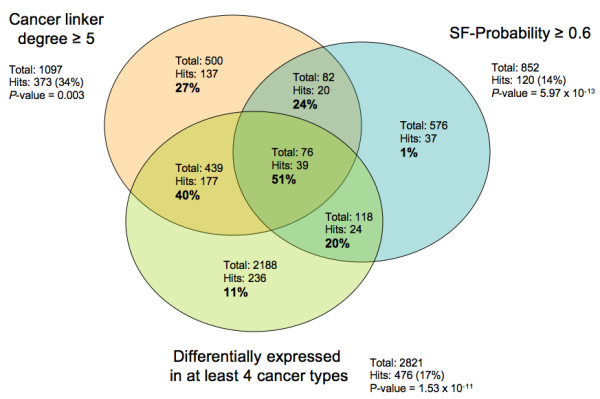
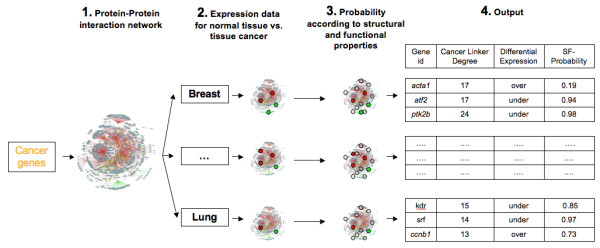
Results: We implemented a systematic method using the PIANA software that predicts cancer involvement of genes by integrating heterogeneous datasets. Specifically, we produced lists of genes likely to be involved in cancer by relying on: (i) protein-protein interactions; (ii) differential expression data; and (iii) structural and functional properties of cancer genes. The integrative approach that combines multiple sources of data obtained positive predictive values ranging from 23% (on a list of 811 genes) to 73% (on a list of 22 genes), outperforming the use of any of the data sources alone. We analyze a list of 20 cancer gene predictions, finding that most of them have been recently linked to cancer in literature.
Conclusion: Our approach to identifying and prioritizing candidate cancer genes can be used to produce lists of genes likely to be involved in cancer. Our results suggest that differential expression studies yielding high numbers of candidate cancer genes can be filtered using protein interaction networks.
Figures
Similar articles
-
Characterization of protein-interaction networks in tumors.BMC Bioinformatics. 2007 Jun 27;8:224. doi: 10.1186/1471-2105-8-224. BMC Bioinformatics. 2007. PMID: 17597514 Free PMC article.
-
CGI: a new approach for prioritizing genes by combining gene expression and protein-protein interaction data.Bioinformatics. 2007 Jan 15;23(2):215-21. doi: 10.1093/bioinformatics/btl569. Epub 2006 Nov 10. Bioinformatics. 2007. PMID: 17098772
-
Probabilistic model of the human protein-protein interaction network.Nat Biotechnol. 2005 Aug;23(8):951-9. doi: 10.1038/nbt1103. Nat Biotechnol. 2005. PMID: 16082366
-
Getting started in biological pathway construction and analysis.PLoS Comput Biol. 2008 Feb;4(2):e16. doi: 10.1371/journal.pcbi.0040016. PLoS Comput Biol. 2008. PMID: 18463709 Free PMC article. Review. No abstract available.
-
Prediction of protein-protein interaction networks.Curr Protoc Bioinformatics. 2003 May;Chapter 8:Unit8.2. doi: 10.1002/0471250953.bi0802s01. Curr Protoc Bioinformatics. 2003. PMID: 18428709 Review.
Cited by
-
Associations of SNPs located at candidate genes to bovine growth traits, prioritized with an interaction networks construction approach.BMC Genet. 2015 Jul 22;16:91. doi: 10.1186/s12863-015-0247-3. BMC Genet. 2015. PMID: 26198337 Free PMC article.
-
Biana: a software framework for compiling biological interactions and analyzing networks.BMC Bioinformatics. 2010 Jan 27;11:56. doi: 10.1186/1471-2105-11-56. BMC Bioinformatics. 2010. PMID: 20105306 Free PMC article.
-
A systematic in silico mining of the mechanistic implications and therapeutic potentials of estrogen receptor (ER)-α in breast cancer.PLoS One. 2014 Mar 10;9(3):e91894. doi: 10.1371/journal.pone.0091894. eCollection 2014. PLoS One. 2014. PMID: 24614816 Free PMC article.
-
Prediction of cancer proteins by integrating protein interaction, domain frequency, and domain interaction data using machine learning algorithms.Biomed Res Int. 2015;2015:312047. doi: 10.1155/2015/312047. Epub 2015 Mar 17. Biomed Res Int. 2015. PMID: 25866773 Free PMC article.
-
Finding minimum gene subsets with heuristic breadth-first search algorithm for robust tumor classification.BMC Bioinformatics. 2012 Jul 25;13:178. doi: 10.1186/1471-2105-13-178. BMC Bioinformatics. 2012. PMID: 22830977 Free PMC article.
References
Publication types
MeSH terms
Substances
LinkOut - more resources
Full Text Sources
Other Literature Sources
