

Evolution of complexity in RNA-like replicator systems
- PMID: 18371199
- PMCID: PMC2390529
- DOI: 10.1186/1745-6150-3-11
Evolution of complexity in RNA-like replicator systems
Abstract
Background: The evolution of complexity is among the most important questions in biology. The evolution of complexity is often observed as the increase of genetic information or that of the organizational complexity of a system. It is well recognized that the formation of biological organization--be it of molecules or ecosystems--is ultimately instructed by the genetic information, whereas it is also true that the genetic information is functional only in the context of the organization. Therefore, to obtain a more complete picture of the evolution of complexity, we must study the evolution of both information and organization.
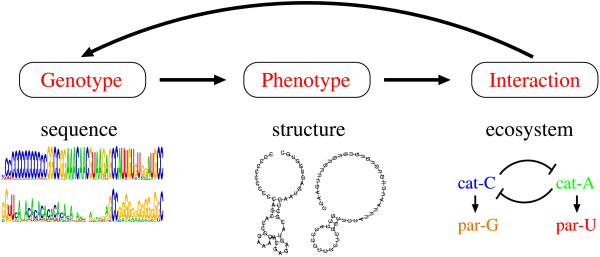
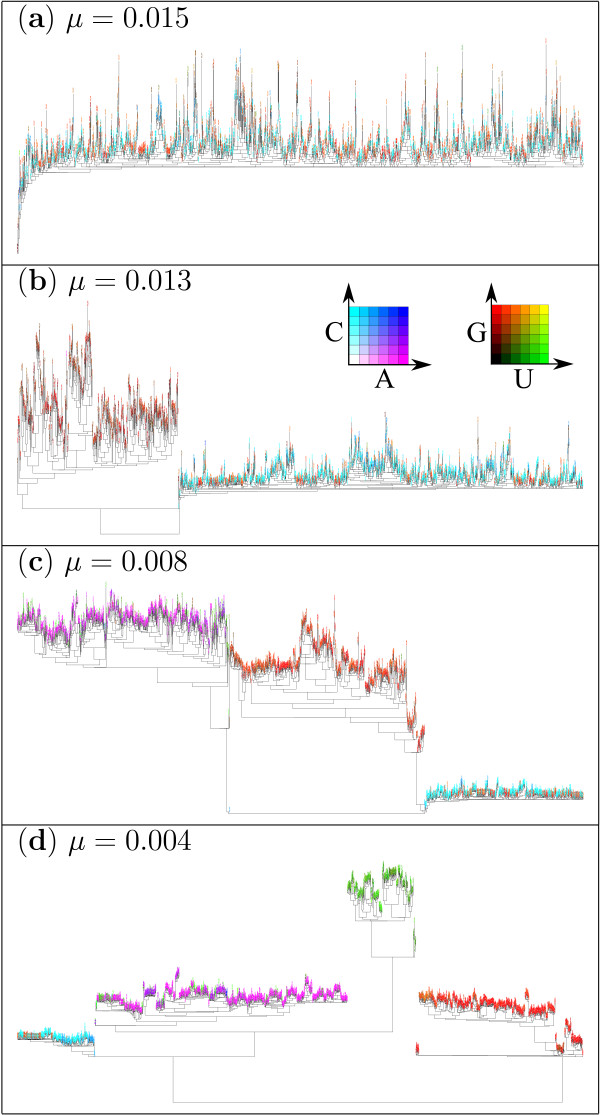
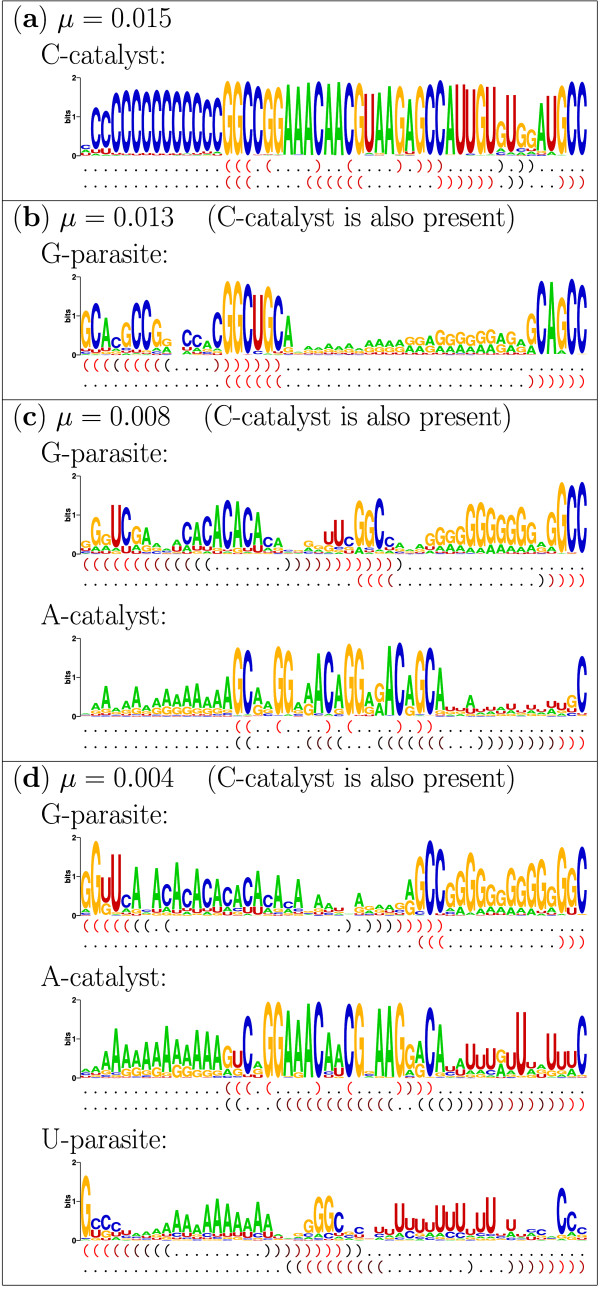
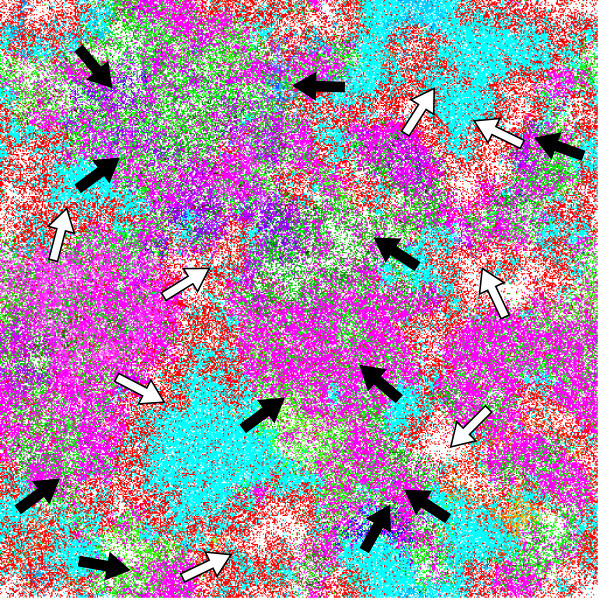
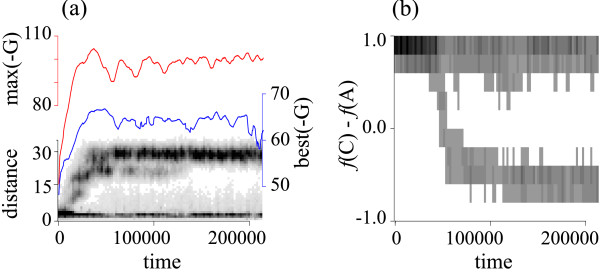
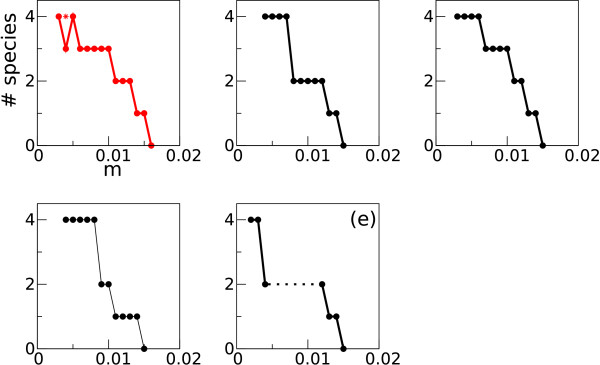
Results: Here we investigate the evolution of complexity in a simulated RNA-like replicator system. The simplicity of the system allows us to explicitly model the genotype-phenotype-interaction mapping of individual replicators, whereby we avoid preconceiving the functionality of genotypes (information) or the ecological organization of replicators in the model. In particular, the model assumes that interactions among replicators--to replicate or to be replicated--depend on their secondary structures and base-pair matching. The results showed that a population of replicators, originally consisting of one genotype, evolves to form a complex ecosystem of up to four species. During this diversification, the species evolve through acquiring unique genotypes with distinct ecological functionality. The analysis of this diversification reveals that parasitic replicators, which have been thought to destabilize the replicator's diversity, actually promote the evolution of diversity through generating a novel "niche" for catalytic replicators. This also makes the current replicator system extremely stable upon the evolution of parasites. The results also show that the stability of the system crucially depends on the spatial pattern formation of replicators. Finally, the evolutionary dynamics is shown to significantly depend on the mutation rate.
Conclusion: The interdependence of information and organization can play an important role for the evolution of complexity. Namely, the emergent ecosystem supplies a context in which a novel phenotype gains functionality. Realizing such a phenotype, novel genotypes can evolve, which, in turn, results in the evolution of more complex ecological organization. Hence, the evolutionary feedback between information and organization, and thereby the evolution of complexity.
Figures
Similar articles
-
Evolutionary dynamics of RNA-like replicator systems: A bioinformatic approach to the origin of life.Phys Life Rev. 2012 Sep;9(3):219-63. doi: 10.1016/j.plrev.2012.06.001. Epub 2012 Jun 13. Phys Life Rev. 2012. PMID: 22727399 Free PMC article. Review.
-
The role of complex formation and deleterious mutations for the stability of RNA-like replicator systems.J Mol Evol. 2007 Dec;65(6):668-86. doi: 10.1007/s00239-007-9044-6. Epub 2007 Oct 23. J Mol Evol. 2007. PMID: 17955153
-
In silico ribozyme evolution in a metabolically coupled RNA population.Biol Direct. 2015 May 27;10:30. doi: 10.1186/s13062-015-0049-6. Biol Direct. 2015. PMID: 26014147 Free PMC article.
-
Less can be more: RNA-adapters may enhance coding capacity of replicators.PLoS One. 2012;7(1):e29952. doi: 10.1371/journal.pone.0029952. Epub 2012 Jan 23. PLoS One. 2012. PMID: 22291898 Free PMC article.
-
Ecology and Evolution in the RNA World Dynamics and Stability of Prebiotic Replicator Systems.Life (Basel). 2017 Nov 27;7(4):48. doi: 10.3390/life7040048. Life (Basel). 2017. PMID: 29186916 Free PMC article. Review.
Cited by
-
Evolutionary dynamics of RNA-like replicator systems: A bioinformatic approach to the origin of life.Phys Life Rev. 2012 Sep;9(3):219-63. doi: 10.1016/j.plrev.2012.06.001. Epub 2012 Jun 13. Phys Life Rev. 2012. PMID: 22727399 Free PMC article. Review.
-
Multilevel selection in models of prebiotic evolution II: a direct comparison of compartmentalization and spatial self-organization.PLoS Comput Biol. 2009 Oct;5(10):e1000542. doi: 10.1371/journal.pcbi.1000542. Epub 2009 Oct 16. PLoS Comput Biol. 2009. PMID: 19834556 Free PMC article.
-
The pig as a mixing vessel for influenza viruses: Human and veterinary implications.J Mol Genet Med. 2008 Nov 27;3(1):158-66. J Mol Genet Med. 2008. PMID: 19565018 Free PMC article.
-
Patch depletion, niche structuring and the evolution of co-operative foraging.BMC Evol Biol. 2011 Nov 17;11:335. doi: 10.1186/1471-2148-11-335. BMC Evol Biol. 2011. PMID: 22093680 Free PMC article.
-
Evolution of resource cycling in ecosystems and individuals.BMC Evol Biol. 2009 Jun 1;9:122. doi: 10.1186/1471-2148-9-122. BMC Evol Biol. 2009. PMID: 19486519 Free PMC article.
References
-
- Schuster P, Fontana W, Stadler PF, Hofacker IL. From sequences to shapes and back: a case study in RNA secondary structures. Proc R Soc Lond B. 1994;255:279–284. - PubMed
-
- Stadler BMR, Stadler PF. Molecular replicator dynamics. Adv Complex Syst. 2004;59:507–519.
-
- Gesteland RF, Cech TR, Atkins JF, (Eds) The RNA world. 3. Cold Spring Harbor: Cold Spring Harbor Lab. Press; 2006.
-
- Eigen M, Schuster P. The hypercycle – a principle of natural self-organization. Berlin: Springer; 1979. - PubMed
Publication types
MeSH terms
Substances
LinkOut - more resources
Full Text Sources
