

par genes in Mycobacterium bovis and Mycobacterium smegmatis are arranged in an operon transcribed from "SigGC" promoters
- PMID: 18371202
- PMCID: PMC2346475
- DOI: 10.1186/1471-2180-8-51
par genes in Mycobacterium bovis and Mycobacterium smegmatis are arranged in an operon transcribed from "SigGC" promoters
Abstract
Background: The ParA/Soj and ParB/Spo0J proteins, and the cis-acting parS site, participate actively in chromosome segregation and cell cycle progression. Genes homologous to parA and parB, and two putative parS copies, have been identified in the Mycobacterium bovis BCG and Mycobacterium smegmatis chromosomes. As in Mycobacterium tuberculosis, the parA and parB genes in these two non-pathogenic mycobacteria are located near the chromosomal origin of replication. The present work focused on the determination of the transcriptional organisation of the ~6 Kb orf60K-parB region of M. bovis BCG and M. smegmatis by primer extension, transcriptional fusions to the green fluorescence protein (GFP) and quantitative RT-PCR.
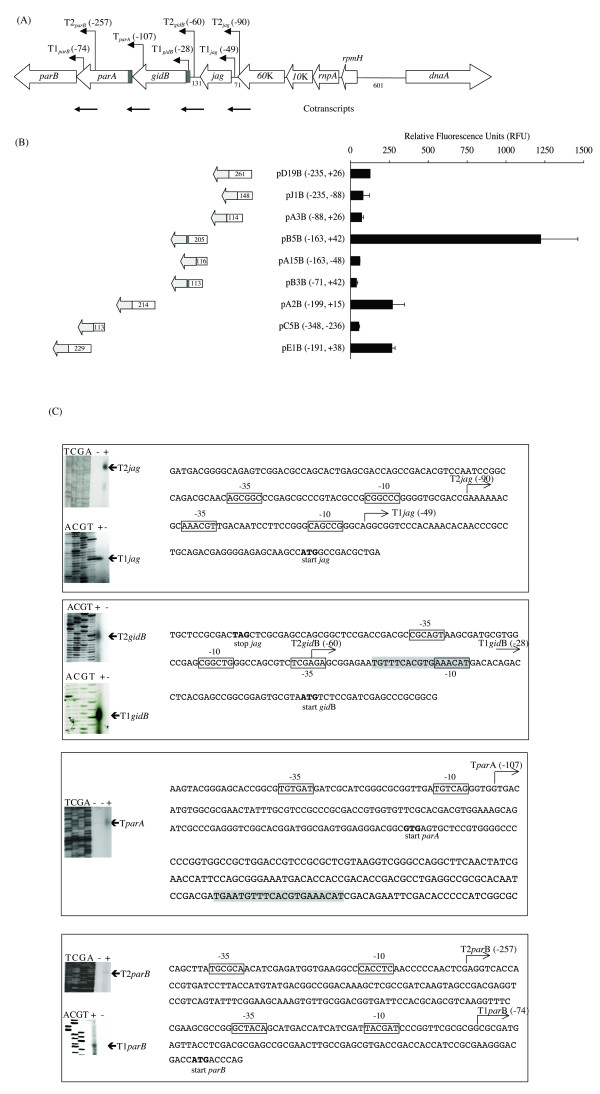
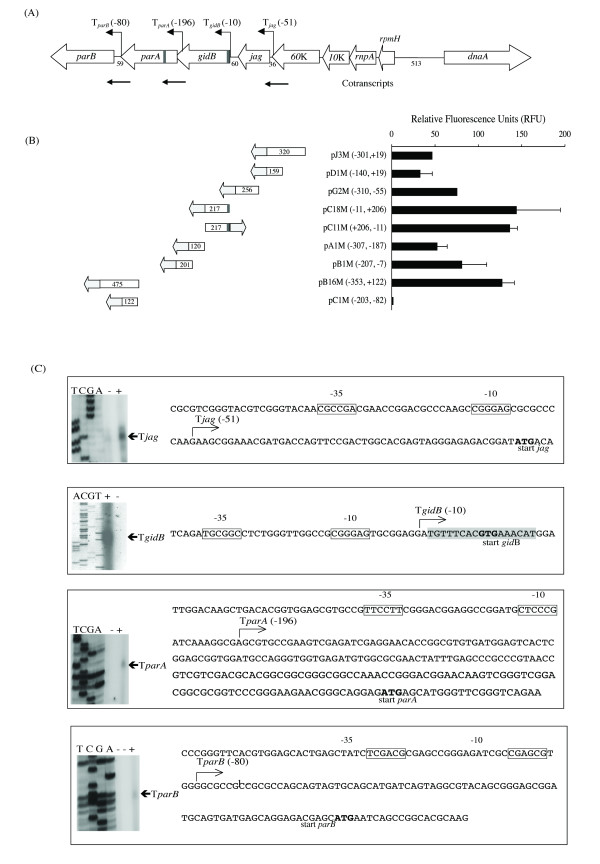
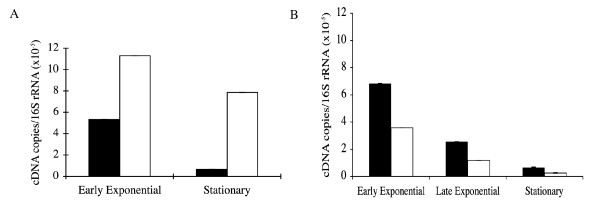
Results: The parAB genes were arranged in an operon. However, we also found promoters upstream of each one of these genes. Seven putative promoter sequences were identified in the orf60K-parB region of M. bovis BCG, whilst four were identified in the homologous region of M. smegmatis, one upstream of each open reading frame (ORF).Real-time PCR assays showed that in M. smegmatis, mRNA-parA and mRNA-parB levels decreased between the exponential and stationary phases. In M. bovis BCG, mRNA-parA levels also decreased between the exponential and stationary phases. However, parB expression was higher than parA expression and remained almost unchanged along the growth curve.
Conclusion: The majority of the proposed promoter regions had features characteristic of Mycobacterium promoters previously denoted as Group D. The -10 hexamer of a strong E. coli sigma70-like promoter, located upstream of gidB of M. bovis BCG, overlapped with a putative parS sequence, suggesting that the transcription from this promoter might be regulated by the binding of ParB to parS.
Figures
Similar articles
-
Rules and Exceptions: The Role of Chromosomal ParB in DNA Segregation and Other Cellular Processes.Microorganisms. 2020 Jan 11;8(1):0. doi: 10.3390/microorganisms8010105. Microorganisms. 2020. PMID: 31940850 Free PMC article. Review.
-
Transcription analysis of the dnaA gene and oriC region of the chromosome of Mycobacterium smegmatis and Mycobacterium bovis BCG, and its regulation by the DnaA protein.Microbiology (Reading). 2003 Mar;149(Pt 3):773-784. doi: 10.1099/mic.0.25832-0. Microbiology (Reading). 2003. PMID: 12634345
-
Characterization of the mycobacterial chromosome segregation protein ParB and identification of its target in Mycobacterium smegmatis.Microbiology (Reading). 2007 Dec;153(Pt 12):4050-4060. doi: 10.1099/mic.0.2007/011619-0. Microbiology (Reading). 2007. PMID: 18048919
-
A mycobacterial extracytoplasmic sigma factor involved in survival following heat shock and oxidative stress.J Bacteriol. 1999 Jul;181(14):4266-74. doi: 10.1128/JB.181.14.4266-4274.1999. J Bacteriol. 1999. PMID: 10400584 Free PMC article.
-
Molecular analysis of the pRA2 partitioning region: ParB autoregulates parAB transcription and forms a nucleoprotein complex with the plasmid partition site, parS.Mol Microbiol. 2001 May;40(3):621-33. doi: 10.1046/j.1365-2958.2001.02405.x. Mol Microbiol. 2001. PMID: 11359568
Cited by
-
Analysis of novel mycobacteriophages indicates the existence of different strategies for phage inheritance in mycobacteria.PLoS One. 2013;8(2):e56384. doi: 10.1371/journal.pone.0056384. Epub 2013 Feb 28. PLoS One. 2013. PMID: 23468864 Free PMC article.
-
Rules and Exceptions: The Role of Chromosomal ParB in DNA Segregation and Other Cellular Processes.Microorganisms. 2020 Jan 11;8(1):0. doi: 10.3390/microorganisms8010105. Microorganisms. 2020. PMID: 31940850 Free PMC article. Review.
-
Stable Regulation of Cell Cycle Events in Mycobacteria: Insights From Inherently Heterogeneous Bacterial Populations.Front Microbiol. 2018 Mar 21;9:514. doi: 10.3389/fmicb.2018.00514. eCollection 2018. Front Microbiol. 2018. PMID: 29619019 Free PMC article. Review.
-
Mycobacterial Growth.Cold Spring Harb Perspect Med. 2015 May 8;5(10):a021097. doi: 10.1101/cshperspect.a021097. Cold Spring Harb Perspect Med. 2015. PMID: 25957314 Free PMC article. Review.
-
Dual-Reporter Mycobacteriophages (Φ2DRMs) Reveal Preexisting Mycobacterium tuberculosis Persistent Cells in Human Sputum.mBio. 2016 Oct 25;7(5):e01023-16. doi: 10.1128/mBio.01023-16. mBio. 2016. PMID: 27795387 Free PMC article.
References
-
- Hiraga S. Chromosome and plasmid partition in Escherichia coli. Annu Rev Biochem. 1992;61:283–306. - PubMed
-
- Koonin EV. A superfamily of ATPases with diverse functions containing either classical or deviant ATP-binding motif. J Mol Biol. 1993;229:1165–1174. - PubMed
-
- Mori H, Kondo A, Ohshima A, Ogura T, Hiraga S. Structure and function of the F ÿplasmid genes essential for partitioning. J Mol Biol. 1986;192:1–15. - PubMed
-
- Austin S, Abeles AL. Partitioning of unit copy miniplasmids to daughter cells. II. The partititon regions of miniplasmid P1 encodes an essential protein and a centromere-like site at which it acts. J Mol Biol. 1983;169:373–387. - PubMed
Publication types
MeSH terms
Substances
LinkOut - more resources
Full Text Sources
Molecular Biology Databases
Research Materials
Miscellaneous
