. 2007 Sep 13;1(3):324-37.
doi: 10.1016/j.stem.2007.05.019.

Unique and independent roles for MLL in adult hematopoietic stem cells and progenitors

Affiliations

Unique and independent roles for MLL in adult hematopoietic stem cells and progenitors

Craig D Jude et al. Cell Stem Cell. .

Abstract

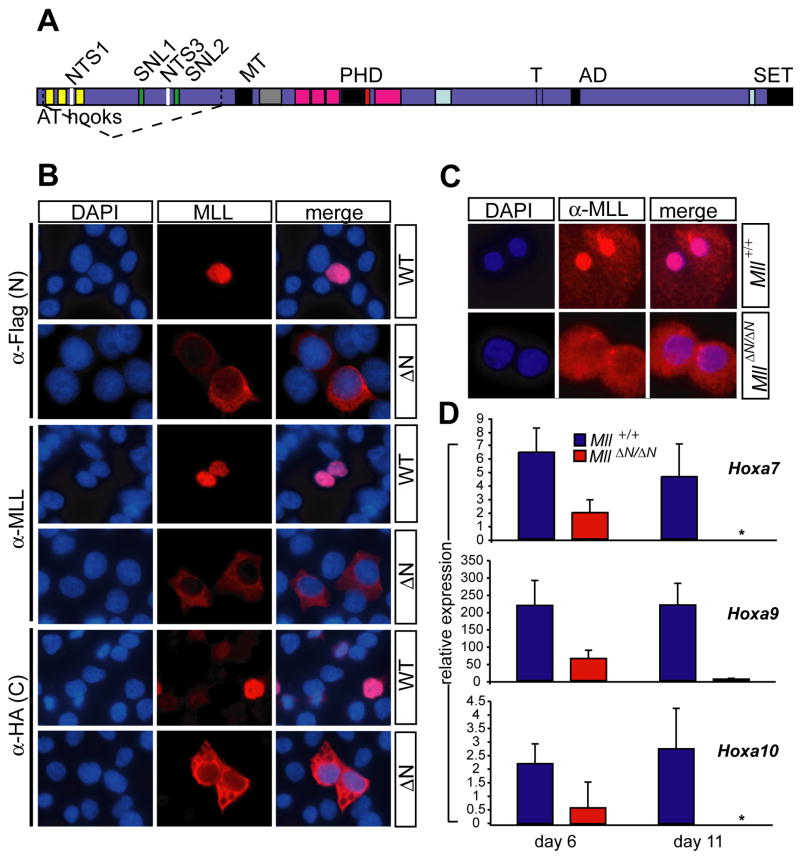
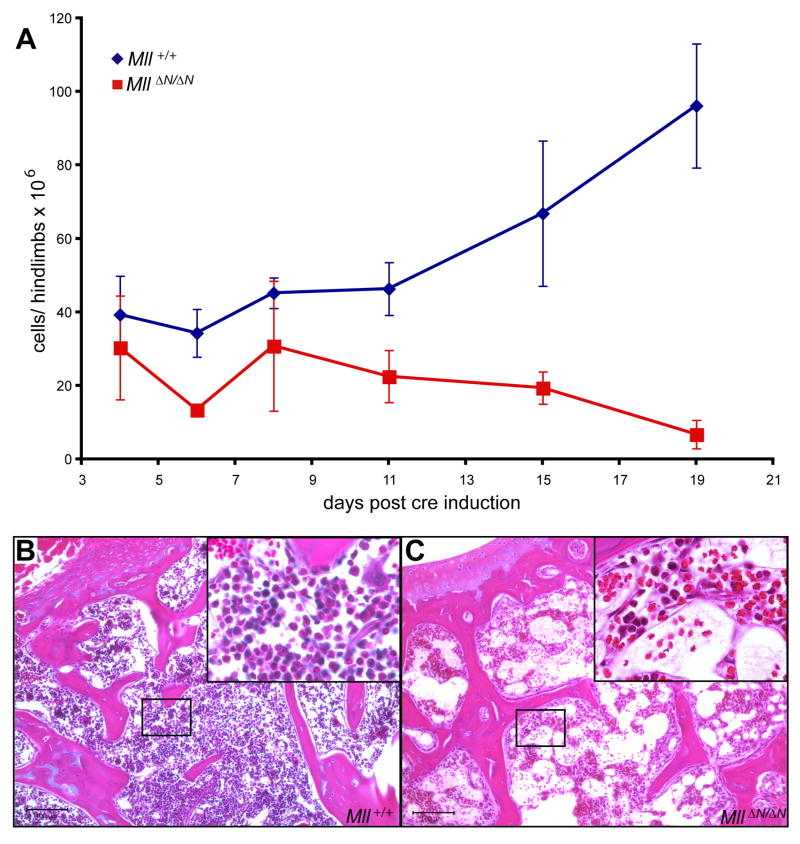
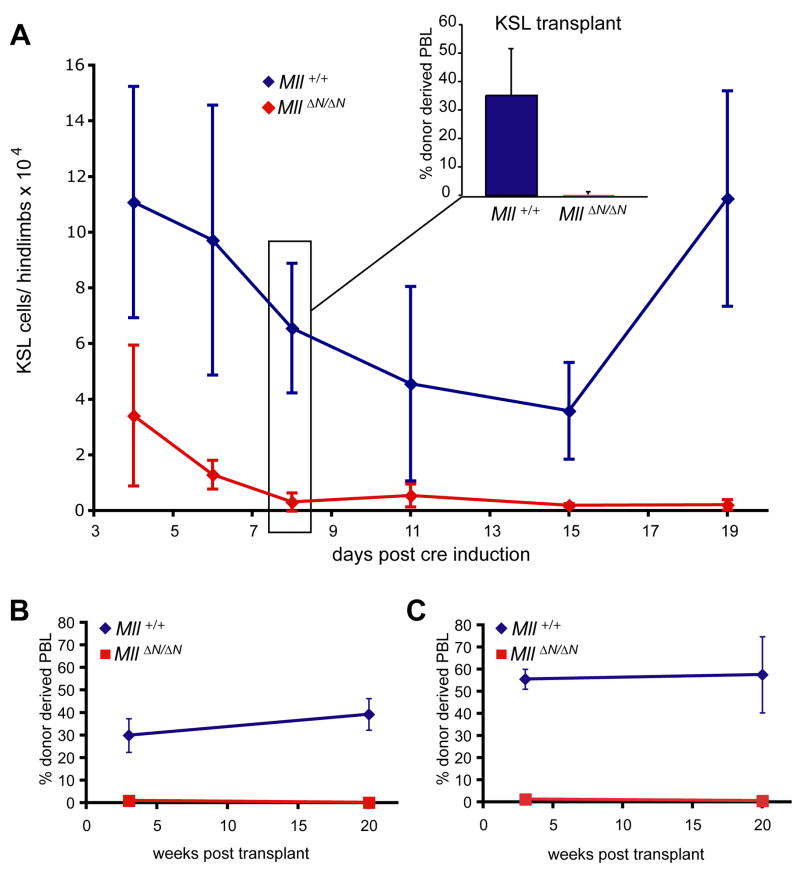
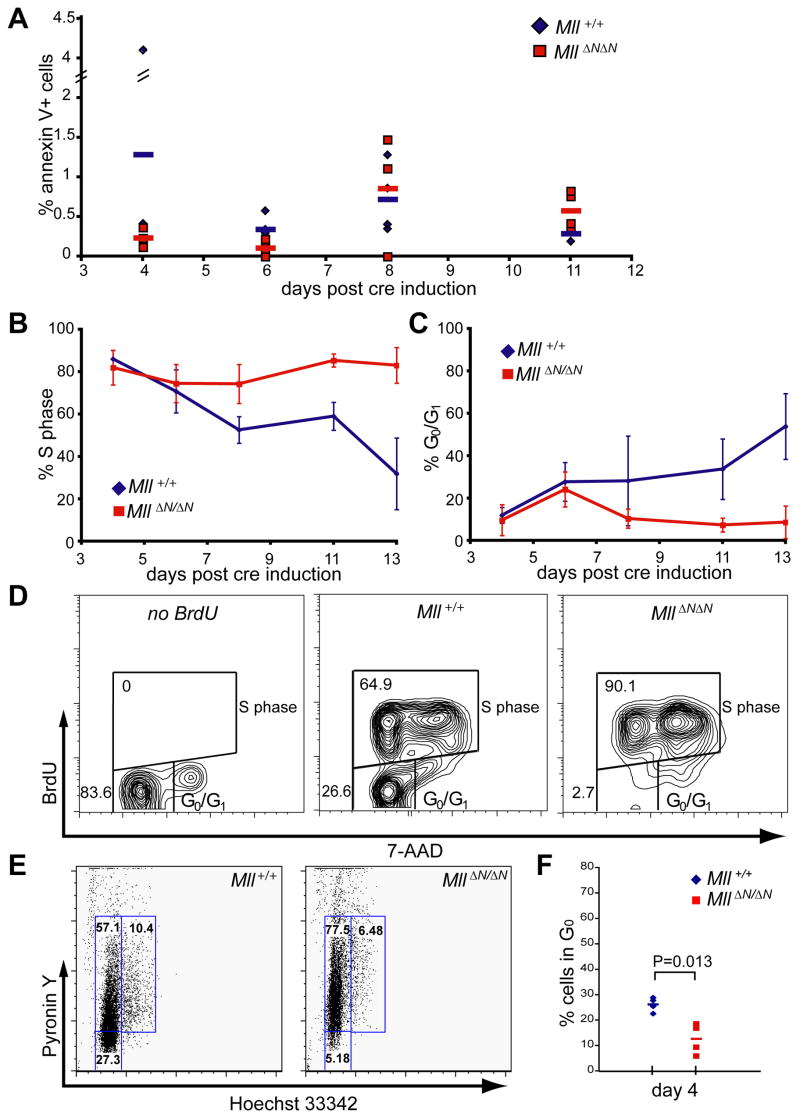
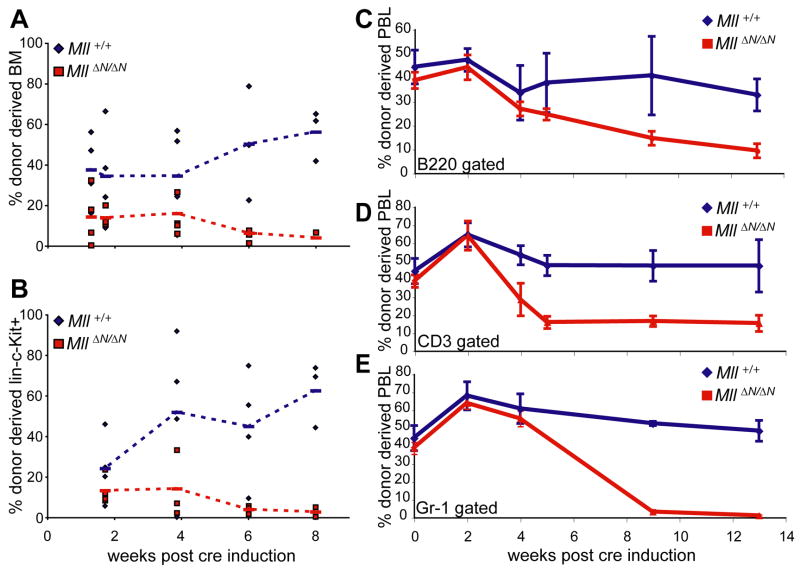
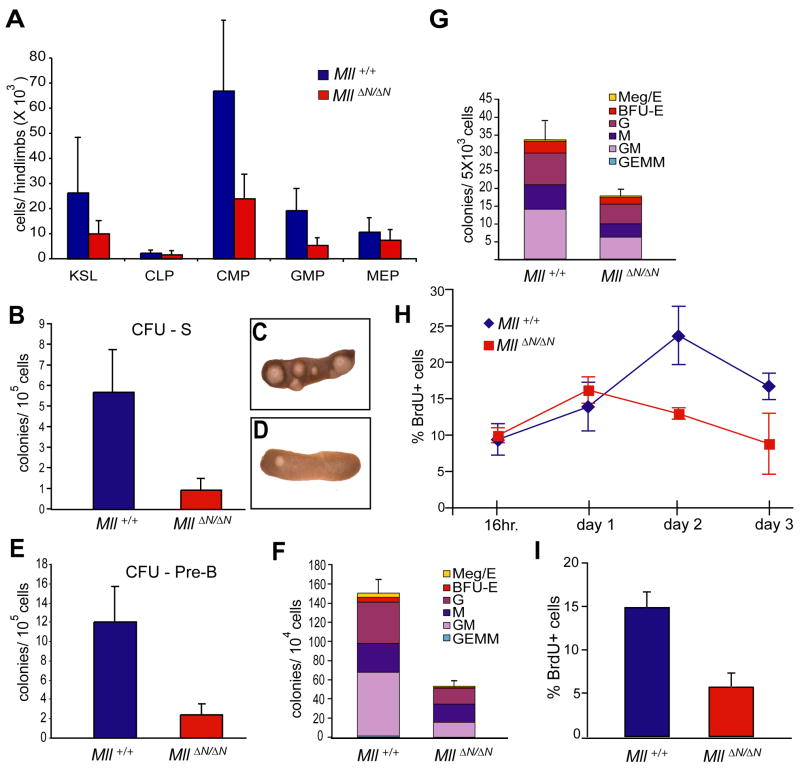
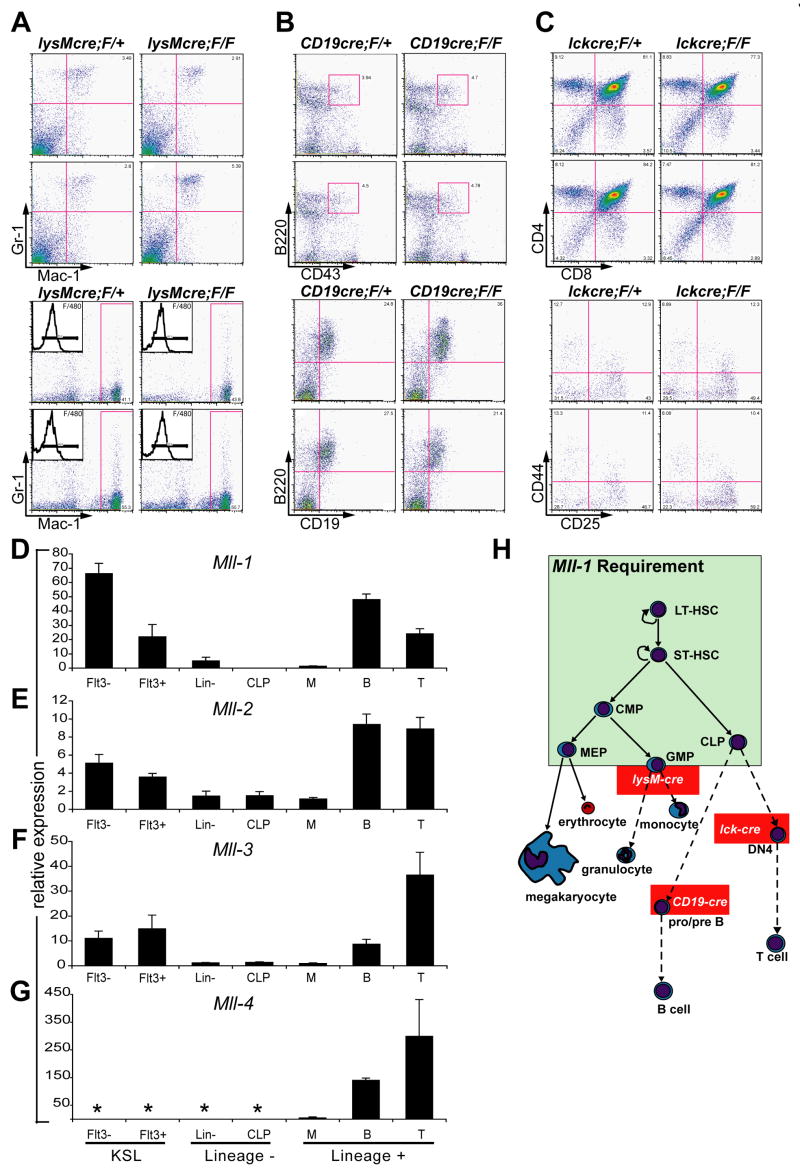
The Mixed Lineage Leukemia (MLL) gene is essential for embryonic hematopoietic stem cell (HSC) development, but its role during adult hematopoiesis is unknown. Using an inducible knockout model, we demonstrate that Mll is essential for the maintenance of adult HSCs and progenitors, with fatal bone marrow failure occurring within 3 weeks of Mll deletion. Mll-deficient cells are selectively lost from mixed bone marrow chimeras, demonstrating their failure to self-renew even in an intact bone marrow environment. Surprisingly, HSCs lacking Mll exhibit ectopic cell-cycle entry, resulting in the depletion of quiescent HSCs. In contrast, Mll deletion in myelo-erythroid progenitors results in reduced proliferation and reduced response to cytokine-induced cell-cycle entry. Committed lymphoid and myeloid cells no longer require Mll, defining the early multipotent stages of hematopoiesis as Mll dependent. These studies demonstrate that Mll plays selective and independent roles within the hematopoietic system, maintaining quiescence in HSCs and promoting proliferation in progenitors.


Figures

Figure 1
Figure 1
The MllΔN allele encodes a cytoplasmic protein with reduced activity. A) Diagram of wild-type MLL with the deletion of sequences encoded by exons 3-4 indicated by dashed lines. Homology motifs are shown as colored bars with the following indicated: AT hooks, minor groove DNA binding motif; SNL1 and 2, subnuclear targeting motif; NTS1 and 3, nuclear targeting signals; MT, DNA methyltransferase homology and CpG binding motif; PHD, plant homeodomain homology regions; T, taspase cleavage sites; AD, activation domain; SET, Su(var)3-9/Enhancer of zeste/Trithorax homology region. B) Localization of tagged transfected wild-type MLL versus MLLΔN. 293T cells were transfected with the construct labeled on the right of the panels, and stained with antibodies indicated at the left. Examples shown are representative of three independent experiments. C) Subcellular localization of endogenous MLL in wild-type (upper panels) and MllΔN/ΔN macrophages (lower panels) derived in vitro from bone marrow cells. D) Relative Hox gene expression levels were determined by quantitative PCR using linneg/low bone marrow cells isolated the days indicated after Mll deletion. Each bar represents the average expression level from at least three animals. Error bars represent the standard deviation of the average relative expression among animals. The asterisk denotes an undetectable Ct.
Figure 2
Figure 2
Mll maintains bone marrow homeostasis. A) Average bone marrow cellularity per 2 hindlimbs as a function of time after the first pI:pC injection. Control animals (blue, Mll+/+) represent pI:pC injected Mx1-cre;Mll+/+ and MllF/F animals (red) represent pI:pC injected Mx1-cre;MllF/F animals. B–C) Hematoxylin and eosin stained sections from the humerus of control (B) or Mx1-cre;MllF/F (C) animals 15 days after pI:pC injection. Slides were imaged at 100X and insets at 400X magnification.
Figure 3
Figure 3
Loss of HSCs upon Mll deletion. A) Total KSL cell number per 2 hindlimbs of control (Mx1-cre;Mll+/+ or MllF/F, blue) or Mx1-cre;MllF/F (red) animals over a 2 week time course. Inset graph shows the results of competitive transplantation assays using 10,000 purified KSL cells to engraft lethally irradiated recipients. The donor cells were purified from Mll+/+ (blue) or MllΔN/ΔN (red) bone marrow from animals as described in (A) 8 days after pI:pC treatment. Peripheral blood contribution was determined 3 weeks after transplantation. For sorting details see Supplemental Fig. 6. B, C) Percentage of Ly5.1+ (donor) peripheral blood leukocytes (PBLs) in lethally irradiated recipients transplanted with control (blue) or MllΔN/ΔN (red) unfractionated bone marrow cells from animals as described in (A). Donor bone marrow was harvested 4 days after pI:pC injection. In both experiments, 3 × 10⁵ wild-type carrier cells were used. These cells were mixed with either an equal number or 3 × 10⁶ donor cells per lethally irradiated recipient for the 1:1 or the 10:1 transplant, respectively. For each set of experiments, 2–4 individual donors and 4–12 recipients were analyzed.
Figure 4
Figure 4
Cell death and proliferation within the MllΔN/ΔN KSL population. A) Control (blue), or MllΔN/ΔN (red) cells were stained with lineage, c-Kit, and Sca-1 antibodies and annexin V to assess cell death within the KSL population over time. The percentage of annexin V+ cells within the KSL gated population is shown from individual animals with the average shown as a bar. For gating examples see Supplemental Fig. 6. B–C) Control (blue), or MllΔN/ΔN (red) cells were stained as above, fixed, then stained with anti-BrdU and 7-AAD. Data in (B) indicates percent BrdU positive KLS cells from at least 3 individual animals per time point with the error bars representing 95% confidence intervals. Data in (C) represents the percentage BrdU negative KSL cells (G0/G1 gate, panel D). D) Representative FACS plots illustrating BrdU and 7-AAD staining of KSL cells 11 days post cre induction. E) Representative Hoechst/Pyronin staining of sorted KLS/CD48neg cells at day 4 post cre induction, and F) compiled Hoechst/Pyronin results from 4 individual animals per genotype based on the gates shown in E. Similar results were obtained in at least 3 independent experiments.
Figure 5
Figure 5
Selective attrition of MllΔN/ΔN cells from mixed bone marrow chimeras. A) Percentage of donor-type cells (Ly5.1+) within total bone marrow of chimeras. Bone marrow chimeras were established by co-injecting equal numbers of Ly5.1 donor bone marrow cells (from either Mx1-cre;Mll+/+ or Mx1-cre;MllF/F donors) plus wild-type bone marrow and waiting >6 weeks until stable engraftment. Chimeras were then injected 4 times with pI:pC and complete excision of Mll was confirmed 2 weeks after the first injection. B) Percentage of donor cells (Ly5.1+) within the linneg/low/c-Kit+ gated population. C–E) Percentage of donor-derived PBLs gated on C) B220 for B-cells, D) CD3 for T-cells, and E) Gr-1 for neutrophils. Blue diamonds, chimeras generated with Mx1-cre;Mll+/+ cells and red squares, chimeras generated with Mx1-cre;MllF/F cells.
Figure 6
Figure 6
Reduction in lymphoid and myeloid progenitors upon Mll deletion. A) Average cell number per 2 hind limbs at day 11 post cre induction for the indicated cell types: c-Kit+/lineageneg/low/Sca-1+ (KLS), common lymphocyte progenitors (CLP), common myeloid progenitors, granulocyte-megakaryocyte progenitors (GMP), megakaryocyte-erythroid progenitors (MEP). Averages are from 3–4 animals and error bars represent 95% confidence intervals. B) Colonies per spleen (CFU-S8) produced from pI:pC injected control (MllF/F, blue) or Mx1-cre;MllF/F donors (red). Donor cells (1 × 10⁵) were harvested from animals 4 days after cre induction. At least 4 donor animals and 16 irradiated recipients were used per genotype. C, D) Representative spleens for Mll+/+ (C) or MllΔN/ΔN (D) donor cells. E) CFU-preB frequency in linneg/low bone marrow. Control (MllF/F, blue) or MllΔN/ΔN cells (red) were generated as in (B) but were enriched in linneg/low cells, plated and scored (see Experimental Procedures). F) CFU-C assay using bone marrow cells prepared as in (E) but anti-IL7Rα and -Sca-1 were included in the lineage mix. Cells from at least 3 donors per genotype were plated in triplicate and colonies were scored 7 days later. Represented are the averages from all replicates with error bars indicating the 95% confidence interval of the averages. Meg/E, megakaryocyte/erythroid; BFU-E, burst formation unit-erythroid; G, granulocyte; M, macrophage; GM, granulocyte/macrophage; GEMM, granulocyte, erythroid, macrophage, megakaryocyte colony. G) CFU-C assay using in vitro produced MllΔN/ΔN bone marrow cells. Linneg/low cells from Mll+/+ or MllF/F bone marrow were infected with a cre-IRES-GFP retrovirus and 5,000 GFP+ cells were plated in methylcellulose in triplicate as described in (E). H) Linneg/low/IL7Rα/Sca-1 cells were enriched from control (MllF/F, blue) or MllΔN/ΔN (red) samples prepared as in (F) from animals 11 days after cre induction. Samples were cultured in liquid medium containing SCF, IL-3, and IL-6. Cells were pulsed for 1 hour with BrdU, harvested and analyzed by flow cytometry at the indicated time points, reflecting days of in vitro culture. I) Cells as described above were incubated with low serum and cytokine-free medium overnight, followed by re-addition of serum and cytokines for 1 hour followed by BrdU pulses as in (H).
Figure 7
Figure 7
Mll is dispensable for homeostasis of lineage-committed cells and is not compensated by close homologs in the primitive hematopoietic compartment. A) Analysis of bone marrow (top 4 panels) and peritoneal cells (bottom 4 panels) in lysozyme M-cre;MllF/+ (left column) and lysozyme M-cre;MllF/F animals (right column). Inset in the lower 4 panels indicates F/480 expression on Mac-1/Gr-1 gated cells. B) Analysis of bone marrow cells of CD19-cre;MllF/+ (left column) and CD19-cre;MllF/F (right column) animals. C) Analysis of thymocytes in lck-cre;MllF/+ (left column) and lck-cre;MllF/F (right column) animals. The lower 4 panels represent CD4/CD8 gated cells stained with the indicated antibodies. Two representative animals are shown for each strain. D–G) The expression of Mll homologs within purified hematopoietic populations. Quantitative real-time PCR results are shown for Mll (Mll-1) (D), Mll-2 (E), Mll-3 (F) and Mll-4 (G). Populations are as described in Fig. 6, with KSL cells further fractionated to enrich HSCs with short- and long-term engrafting potential (Flt3+ and Flt3, respectively). Also tested are the populations predicted to be affected in the lineage-specific cre strains: myelomonocytic precursors (M, Mac-1+/Gr-1+), pro/pre-B cells (B, B220+/CD19+), and double positive T-cells (T, CD4+/CD8+). Results represent the mean of triplicate reactions with all expression levels normalized to Gapdh. Error bars indicate standard deviation and asterisks indicate an undetectable Ct. Similar results were obtained in three independent experiments. H) Model illustrating the essential, non-redundant role of MLL in maintaining stem and progenitor cells. The green box encompasses cells affected by MLL loss, with those outside the box unaffected at the level of steady-state cell numbers. Red boxes indicate point at which lineage-specific cre expression occurs using the strains shown.

Similar articles

Cited by

References

    1. Armstrong SA, Staunton JE, Silverman LB, Pieters R, den Boer ML, Minden MD, Sallan SE, Lander ES, Golub TR, Korsmeyer SJ. MLL translocations specify a distinct gene expression profile that distinguishes a unique leukemia. Nat Genet. 2002;30:41–47. - PubMed
    1. Ayton P, Sneddon SF, Palmer DB, Rosewell IR, Owen MJ, Young B, Presley R, Subramanian V. Truncation of the Mll gene in exon 5 by gene targeting leads to early preimplantation lethality of homozygous embryos. Genesis. 2001;30:201–212. - PubMed
    1. Ayton PM, Cleary ML. Molecular mechanisms of leukemogenesis mediated by MLL fusion proteins. Oncogene. 2001;20:5695–5707. - PubMed
    1. Ayton PM, Cleary ML. Transformation of myeloid progenitors by MLL oncoproteins is dependent on Hoxa7 and Hoxa9. Genes Dev. 2003;17:2298–2307. - PMC - PubMed
    1. Bijl J, Thompson A, Ramirez-Solis R, Krosl J, Grier DG, Lawrence HJ, Sauvageau G. Analysis of HSC activity and compensatory Hox gene expression profile in Hoxb cluster mutant fetal liver cells. Blood. 2006;108:116–122. - PMC - PubMed

Publication types

MeSH terms

Substances