. 2007 Nov;1(5):578-91.
doi: 10.1016/j.stem.2007.10.003.

Hematopoietic fingerprints: an expression database of stem cells and their progeny

Affiliations

Hematopoietic fingerprints: an expression database of stem cells and their progeny

Stuart M Chambers et al. Cell Stem Cell. 2007 Nov.

Abstract

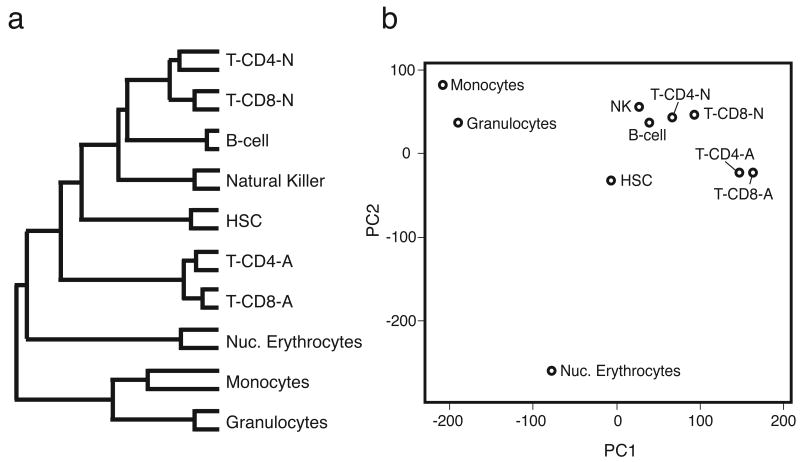
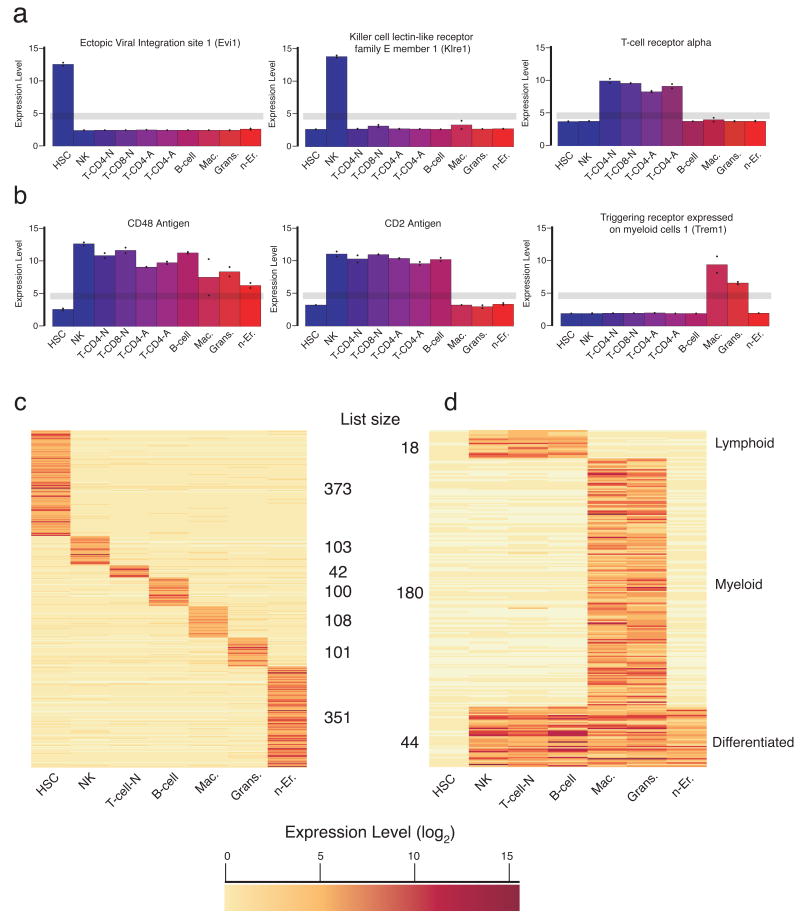
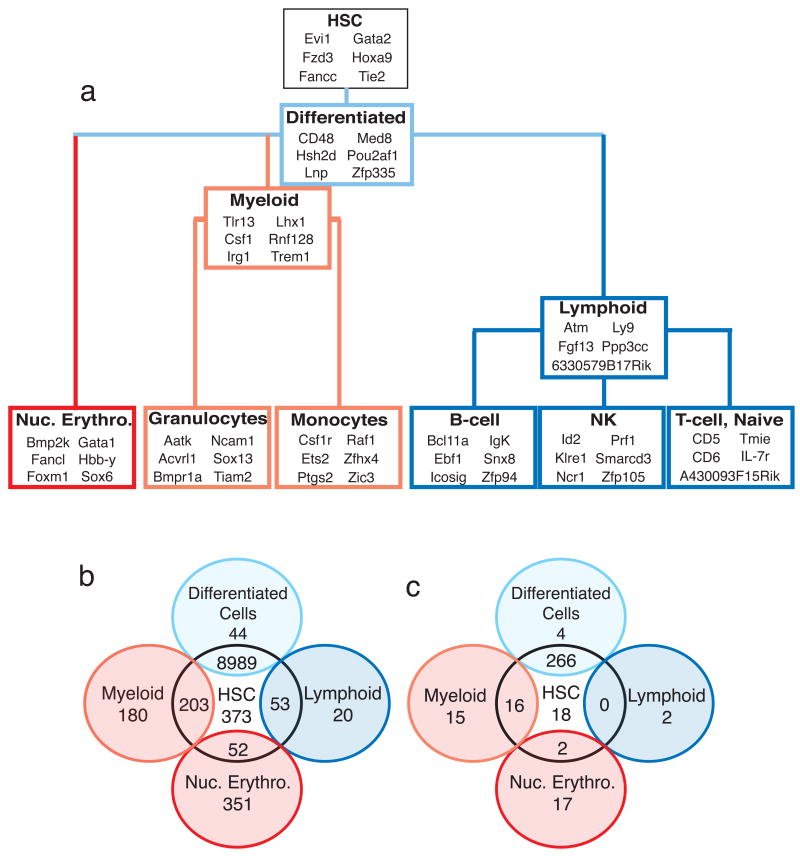
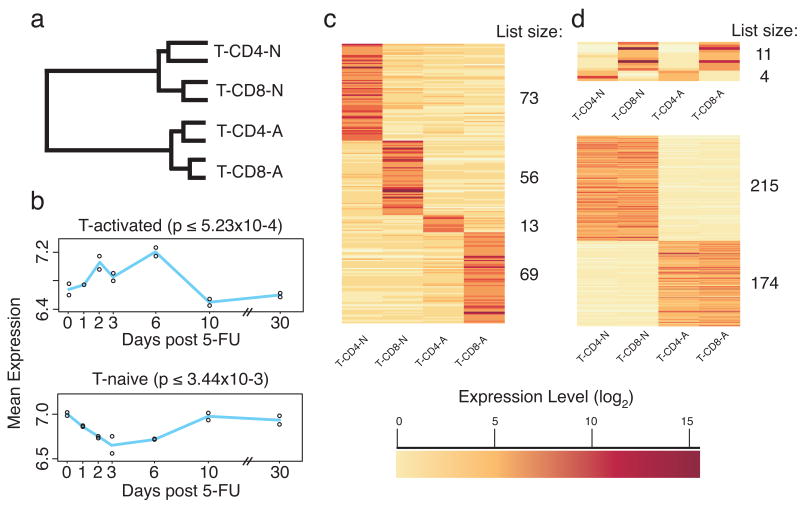
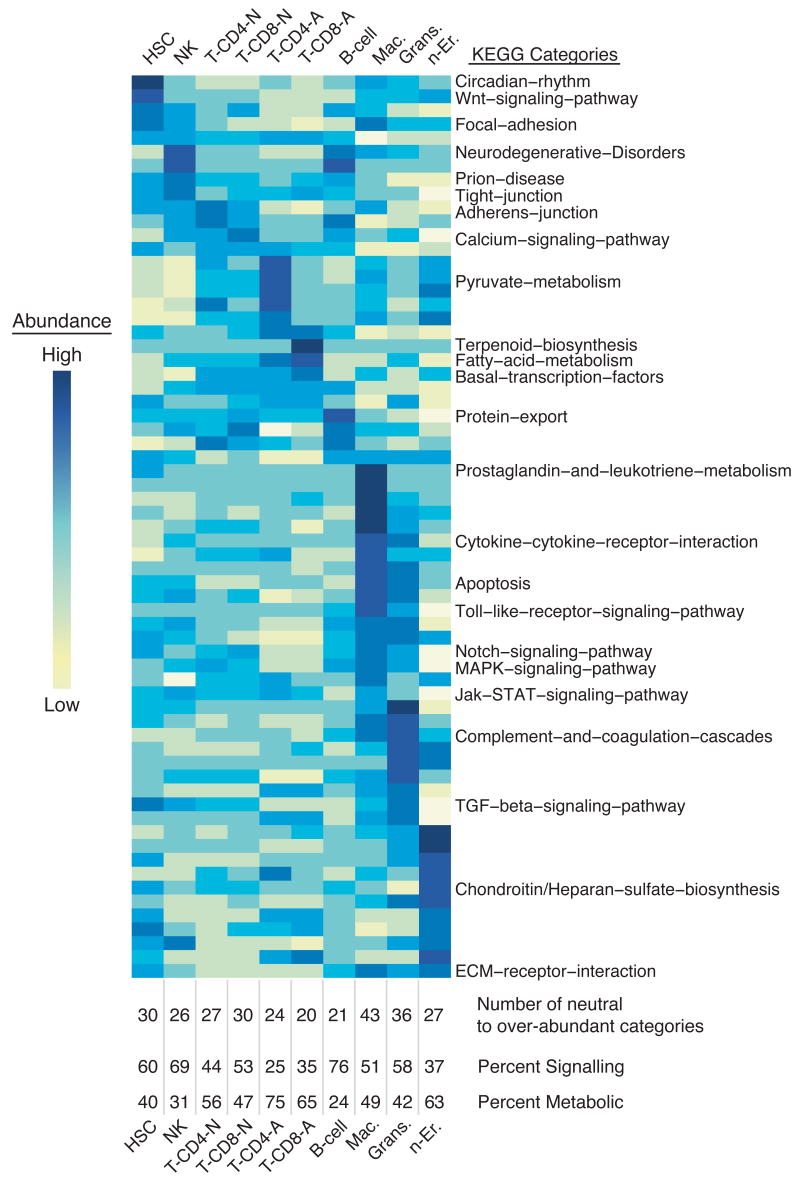
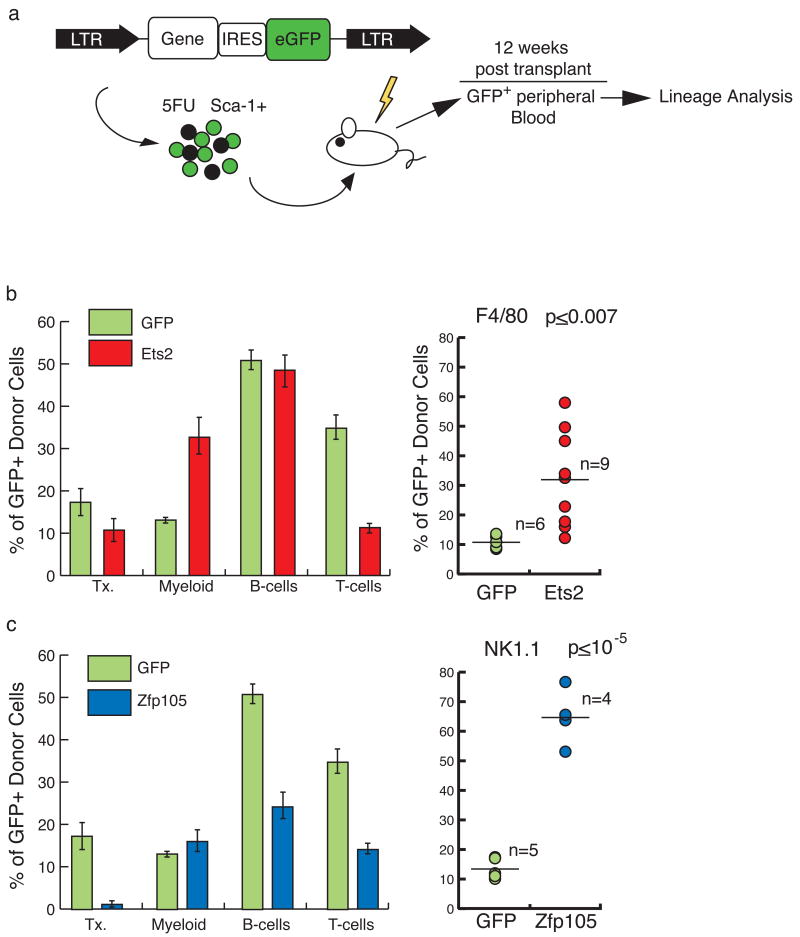
Hematopoietic stem cells (HSCs) continuously regenerate the hematologic system, yet few genes regulating this process have been defined. To identify candidate factors involved in differentiation and self-renewal, we have generated an expression database of hematopoietic stem cells and their differentiated progeny, including erythrocytes, granulocytes, monocytes, NK cells, activated and naive T cells, and B cells. Bioinformatic analysis revealed HSCs were more transcriptionally active than their progeny and shared a common activation mechanism with T cells. Each cell type also displayed unique biases in the regulation of particular genetic pathways, with Wnt signaling particularly enhanced in HSCs. We identified approximately 100-400 genes uniquely expressed in each cell type, termed lineage "fingerprints." In overexpression studies, two of these genes, Zfp 105 from the NK cell lineage, and Ets2 from the monocyte lineage, were able to significantly influence differentiation toward their respective lineages, demonstrating the utility of the fingerprints for identifying genes that regulate differentiation.


Figures

Figure 1
Figure 1. Global transcription profile analysis reveals hematopoietic cell ontogeny
Expression differences between microarrays were assessed on the basis of cluster analysis and principle components analysis (PCA). (a) A dendrogram displays distance in a branching fashion where the right-most branch point indicates the cell types with the highest degree of similarity, with replicates most similar. The HSC are most transcriptionally similar to lymphocytes, with activated T-cells quite distinct. (b) When relative distance is collapsed to two dimensions using PCA, the HSC resides at a midpoint between lymphocytes, myeloid cells, and erythrocytes.
Figure 2
Figure 2. Unique genetic fingerprints for hematopoietic cell types
The normalized (log2) expression intensity is shown. The grey line indicates the threshold window, above which a gene was considered to be expressed, and below which, non-expressed, for selection of uniquely expressed genes in the “fingerprints.” (a) Shown are three examples of genes expressed in a specific cell type, or (b) a group of cell types including all differentiated cells, lymphocytes, or myeloid cells. The fingerprints are summarized in a heat map (color indicates normalized expression level (log2); darker corresponds to higher expression): (c) cell-type specific fingerprints, and (d) shared fingerprints.
Figure 3
Figure 3. Examples of fingerprint genes and phenotype assessment
(a) Selected genes from each of the cell-type and shared fingerprints are shown in context with their developmental relationships. (b) A Venn diagram summarizes the number of shared genes in the different fingerprints. (c) Venn diagram summarizes the number of knockout mice with hematopoietic phenotypes in each of the indicated gene groups. Not all cell types and intersections are shown.
Figure 4
Figure 4. T-cell and HSC activation are transcriptionally similar
T-cell data was analyzed independent of other cell types. (a) Cluster analysis indicates that activation state drives T-cell sub-set differences. (b) Genes involved in T-cell activation are up regulated during HSC activation. A pair-wise comparison between naïve and activated T-cells (including both CD4+ and CD8+ cells) was used to generate a list of genes up regulated in activated or naïve T-cells. The mean expression values of genes in these lists (Up-in-Naïve and Up-in-Activated) was plotted from the HSC activation time-course data. Genes up regulated during T-cell activation were upregulated during HSC activation (top panel), peaking at day 6 when HSCs are most highly replicating, mirroring genes in the HSC proliferation signature (P-sig). Genes upregulated in naïve T-cells were down regulated during HSC activation (bottom panel), as genes in the quiescence signature (Q-sig). The p-value is from a one-way ANOVA for significant changes across the 5-FU time course. (c) A T-cell fingerprint independent of the other cell types. (d) Shared fingerprints for CD4+, CD8+, and ‘naïve’ and ‘activated’ T-cells were also identified. Gene list sizes are indicated to the right side of each heat map (color indicates normalized expression level (log2); darker corresponds to higher expression).
Figure 5
Figure 5. Molecular pathway analysis of hematopoietic cells using KEGG
KEGG was used to identify which cell types exhibit an over- or under-abundance of components of a molecular pathways, with significant differences between cell types determined by an ANOVA (one way, α = 0.05). For pathways containing genes found on the array, the mean expression value for all genes within a pathway for each cell type is displayed as a function of color (yellow corresponds to low average expression, dark blue to high). Pathways are ordered by high expression within a cell type from left to right. Below the heat map, the number of neutral to over-abundant categories is denoted, and the percent of those pathways that are signaling and metabolic is indicated. This method identified differences in KEGG pathway activity between the cell types; pathways equally active in all cell types will not appear significant.
Figure 6
Figure 6. Chromosomal expression density indicates a more open chromatin state for HSC compared to other cell types
(a) Chromosomal expression maps were plotted as described in the text, and then subtracted against each other. On the X-chromosome, HSCs exhibit many more regions where multiple adjacent genes are expressed, seen as the curve above the grey line (representing 0, or no difference between the cell types). (b) The converse is true for erythrocytes on the X-chromosome. (c) On a per chromosome basis, differences in expression density between cell types were determined, where a positive value (% more open) represents a greater number of expressed genes and open chromatin for the indicated cell type compared to each other cell type. Results indicate more open chromatin for HSCs and a closed chromatin state for n-Er. Chromosomes 17 and 8 are relatively more open in monocytes, whereas there are more highly expressed regions on chromosome 14 in erythroid cells.
Figure 7
Figure 7. Retroviral transduction of fingerprint genes Ets2 and Zfp105 biases cell fate
(a) HSCs were transduced using a MSCV-based vector that generates a bicistronic mRNA containing eGFP linked to either Ets2 or Zfp105. The control vector contained eGFP alone. Transduced cells were transplanted into recipients, and eGFP-positive blood was analyzed 12 weeks later and compared to the eGFP-vector control. (b) The overall proportion of transduced cells (transduction, Tx.), and the proportions of transduced myeloid, and lymphoid cells were determined (left; error bars represent standard error; GFP n=6; Ets2 n=9). Compared to vector control, Ets2 enhanced myeloid differentiation to the detriment of T-cell contribution. F4/80-positive transduced monocytes in the blood were elevated (P≤0.007). (c) Zfp105 transplants exhibited a depression in B- and T-cells, and low transduction (left; GFP n=5; Zfp105 n=4). NK1.1-positive GFP+NK cells in peripheral blood were elevated ∼5-fold (p≤10-5) [P-values are based on a two sample T-test assuming equal variances, alpha=0.05.] * Indicates a P-value ≤ 0.05.

Similar articles

Cited by

References

    1. Adolfsson J, Mansson R, Buza-Vidas N, Hultquist A, Liuba K, Jensen CT, Bryder D, Yang L, Borge OJ, Thoren LA, et al. Identification of Flt3+ lympho-myeloid stem cells lacking erythro-megakaryocytic potential a revised road map for adult blood lineage commitment. Cell. 2005;121:295–306. - PubMed
    1. Akashi K, He X, Chen J, Iwasaki H, Niu C, Steenhard B, Zhang J, Haug J, Li L. Transcriptional accessibility for genes of multiple tissues and hematopoietic lineages is hierarchically controlled during early hematopoiesis. Blood. 2003;101:383–389. - PubMed
    1. Allison DB, Cui X, Page GP, Sabripour M. Microarray data analysis: from disarray to consolidation and consensus. Nat Rev Genet. 2006;7:55–65. - PubMed
    1. Aperlo C, Pognonec P, Stanley ER, Boulukos KE. Constitutive c-ets2 expression in M1D+ myeloblast leukemic cells induces their differentiation to macrophages. Mol Cell Biol. 1996;16:6851–6858. - PMC - PubMed
    1. Arai F, Hirao A, Ohmura M, Sato H, Matsuoka S, Takubo K, Ito K, Koh GY, Suda T. Tie2/angiopoietin-1 signaling regulates hematopoietic stem cell quiescence in the bone marrow niche. Cell. 2004;118:149–161. - PubMed

Publication types

MeSH terms