. 2007 Dec 13;1(6):635-45.
doi: 10.1016/j.stem.2007.10.001.

Identification of a hierarchy of multipotent hematopoietic progenitors in human cord blood

Affiliations

Identification of a hierarchy of multipotent hematopoietic progenitors in human cord blood

Ravindra Majeti et al. Cell Stem Cell. .

Abstract

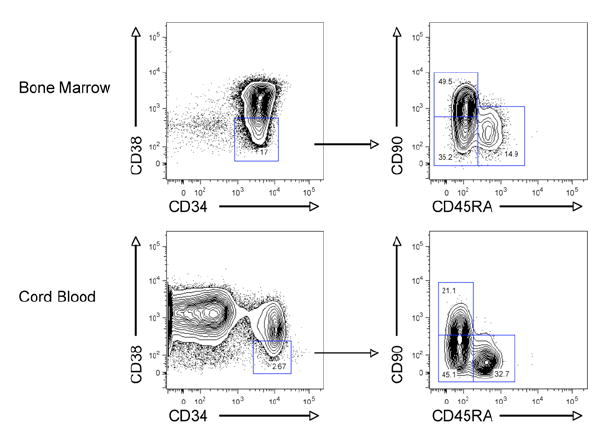
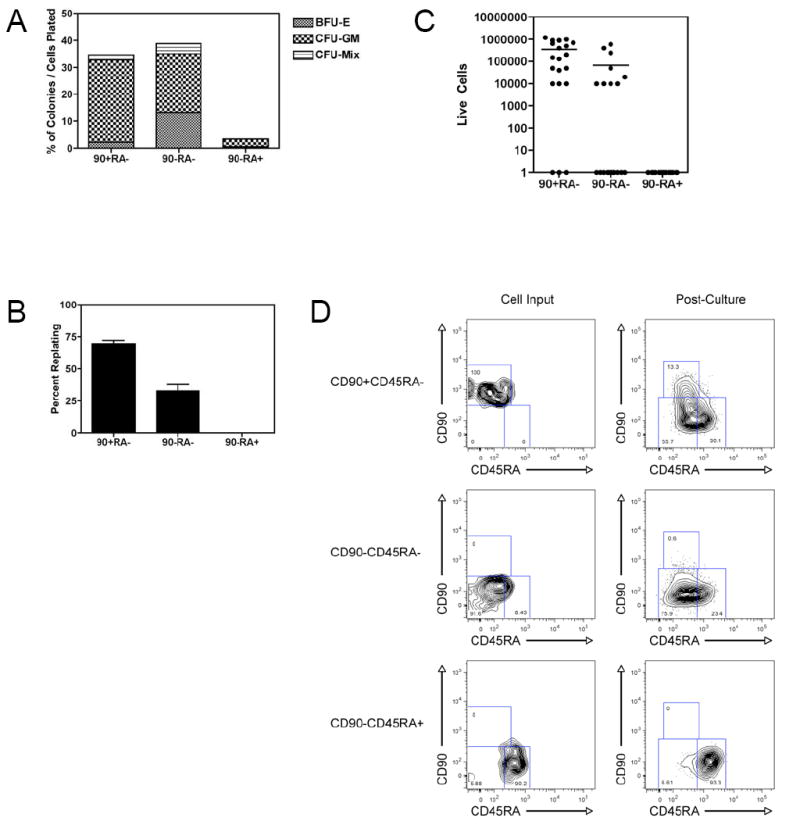
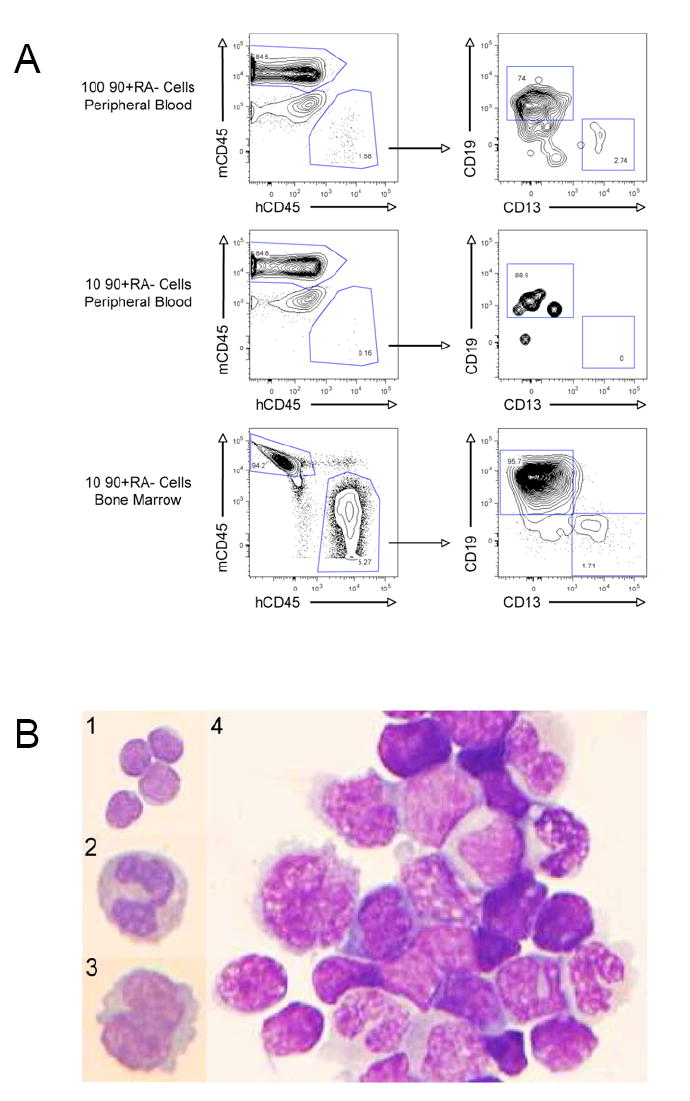
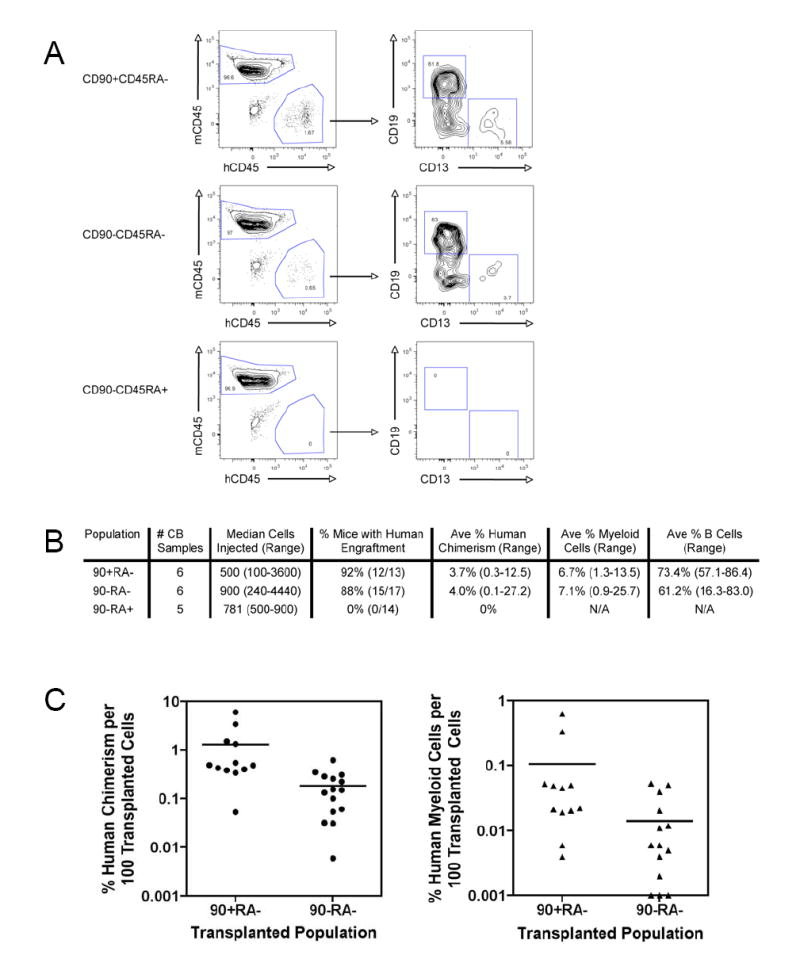
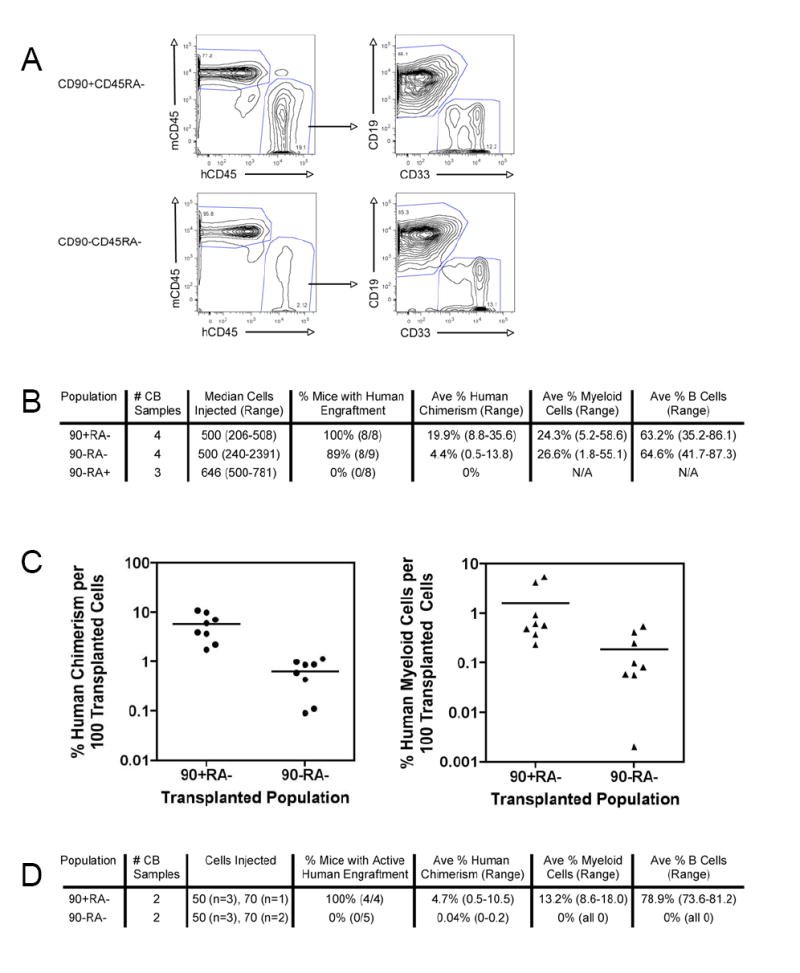
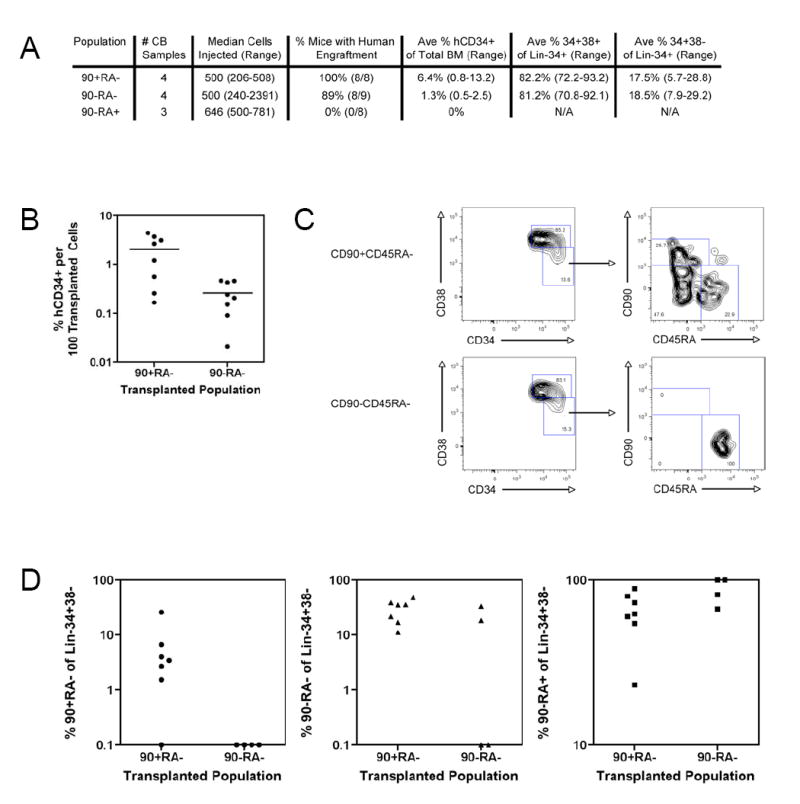
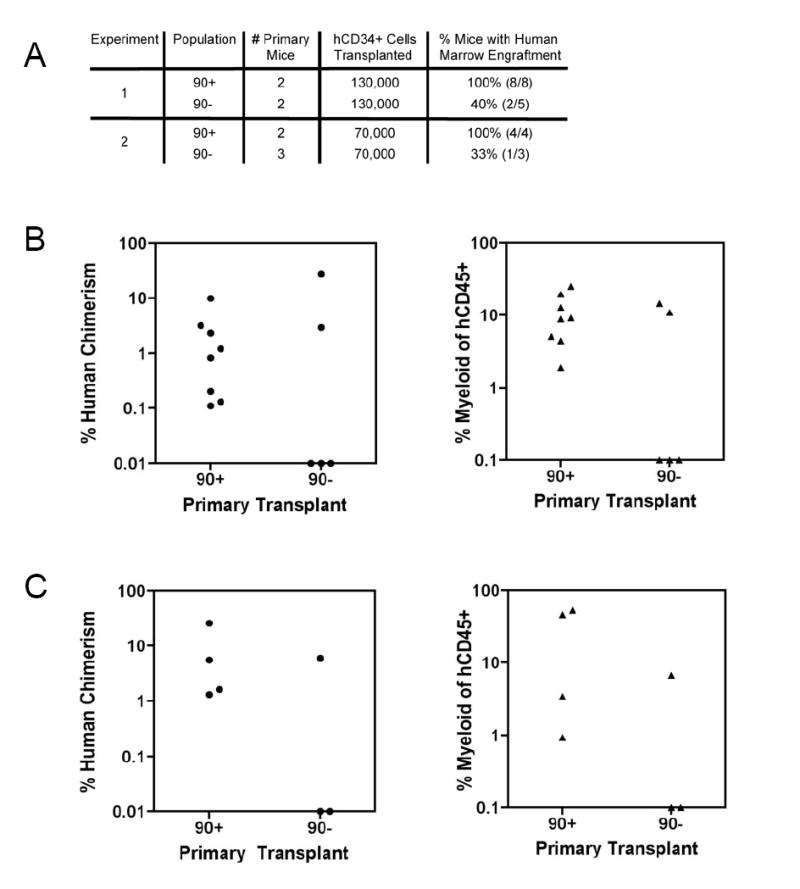
Mouse hematopoiesis is initiated by long-term hematopoietic stem cells (HSC) that differentiate into a series of multipotent progenitors that exhibit progressively diminished self-renewal ability. In human hematopoiesis, populations enriched for HSC activity have been identified, as have downstream lineage-committed progenitors, but multipotent progenitor activity has not been uniquely isolated. Previous reports indicate that human HSC are enriched in Lin-CD34+CD38- cord blood and bone marrow and express CD90. We demonstrate that the Lin-CD34+CD38- fraction of cord blood and bone marrow can be subdivided into three subpopulations: CD90+CD45RA-, CD90-CD45RA-, and CD90-CD45RA+. Utilizing in vivo transplantation studies and complementary in vitro assays, we demonstrate that the Lin-CD34+CD38-CD90+CD45RA- cord blood fraction contains HSC and isolate this activity to as few as 10 purified cells. Furthermore, we report the first prospective isolation of a population of candidate human multipotent progenitors, Lin-CD34+CD38-CD90-CD45RA- cord blood.


Figures

Figure 1
Figure 1. Identification of CD90/CD45RA Subpopulations of Lin-CD34+CD38-Human Bone Marrow and Cord Blood
Normal human bone marrow (top) and cord blood (bottom) were analyzed for expression of lineage markers, CD34, CD38, CD90, and CD45RA by flow cytometry. The bone marrow sample was CD34-enriched prior to analysis. The left panels are gated on lineage negative (Lin-) live cells, while the right panels are gated on Lin-CD34+CD38- cells. Data shown is representative of multiple samples of bone marrow (n=10) and cord blood (n=22).
Figure 2
Figure 2. In Vitro Evaluation of the CD90/CD45RA Subpopulations of Lin-CD34+CD38- Cord Blood Reveals a Developmental Hierarchy
A. Methylcellulose colony formation Single cells from each CD90/CD45RA subpopulation were sorted into individual wells of a 96 well plate containing complete methylcellulose capable of supporting growth of all types of myeloid colonies. After 12-14 days, colonies were scored based on morphology. The percent of each type of colony out of the total cells plated is indicated. Data presented is cumulative from 3 experiments of 60 cells each, for a total of 180 cells per subpopulation. B. Methylcellulose colony replating All colonies derived from individual cells were harvested, dissociated, and replated in complete methylcellulose. 12-14 days later, the formation of new colonies was scored based on morphology. 42 out of 62 (70%) of CD90+CD45RA-, 23 out of 70 (33%) of CD90-CD45RA-, and 0 out of 6 (0%) of CD90-CD45RA+ colonies formed new colonies upon replating. The difference in replating efficiency between CD90+CD45RA- and CD90-CD45RA- was statistically significant (p=0.003). Data presented is the average of 3 independent experiments with the indicated SEM. C. In vitro proliferation 20 cells of each CD90/CD45RA subpopulation were clone sorted into individual wells of a 96 well plate containing serum-free media supplemented with human LDL and cytokines. After 2 weeks in culture, cells were harvested and live cells counted by trypan blue exclusion. The difference between the CD90+CD45RA- and the CD90-CD45RA- subpopulations was statistically significant (p=0.007). Data is representative of 3 independent experiments. D. In vitro hierarchical relationships among CD90/CD45RA subpopulations CD90/CD45RA subpopulations were sorted in bulk into serum-free media supplemented with human LDL and cytokines. Cells were cultured for four days and then re-analyzed by flow cytometry. All plots shown are gated on Lin-CD34+CD38- cells; the left panels show the cell input; the right panels show the cells after four days in culture. Data shown is representative of 3 independent experiments.
Figure 3
Figure 3. Long-Term In Vivo Multipotent Human Hematopoiesis with Transplantation of as few as 10 Lin-CD34+CD38-CD90+CD45RA- Cord Blood Cells
A. In vivo engraftment of 100 or 10 CD90+CD45RA- cells 100 or 10 FACS-purified CD90+CD45RA- cells were transplanted into NOG newborn mice as described. 12 weeks later peripheral blood and/or bone marrow was harvested and analyzed by flow cytometry for the presence of human CD45+ hematopoietic cells, myeloid cells (hCD45+CD13+), and B lymphoid cells (hCD45+CD19+) cells. The right plots are gated on human CD45+ cells. B. Wright-Giemsa stained cytospin preparations from CD90+CD45RA- engrafted mice Human CD45+ cells were purified by FACS from peripheral blood (panels 1-3) or bone marrow (panel 4) of mice engrafted with CD90+CD45RA- cells. In the peripheral blood, (1) lymphocytes, (2) neutrophils, and (3) monocytes were detected; in the bone marrow (4) lymphocytes and maturing myeloid cells were detected. (100x)
Figure 4
Figure 4. Human Lymphoid and Myeloid Cells Reconstitute the Peripheral Blood of CD90/CD45RA Transplanted Mice
A. Peripheral blood engraftment and lineage analysis of CD90/CD45RA transplanted mice 500 FACS-purified cells of each CD90/CD45RA subpopulation: CD90+CD45RA- (top panels), CD90-CD45RA- (middle panels), and CD90-CD45RA+ (bottom panels), were transplanted into NOG newborn mice as described. 12 weeks later peripheral blood was harvested and analyzed by flow cytometry for the presence of human CD45+ hematopoietic cells, myeloid cells (hCD45+CD13+), and B lymphoid cells (hCD45+CD19+) cells. The right plots are gated on human CD45+ cells. B. Summary of long-term (> 12 weeks) peripheral blood engraftment of CD90/CD45RA subpopulations C. Peripheral blood engraftment per 100 transplanted cells The percent human chimerism (left) and percent human myeloid cells (right) per 100 transplanted cells is indicated for each engrafted mouse. Each circle or triangle represents an individual mouse and the bar indicates the average. On average, CD90+CD45RA- mice developed 7 fold more human chimerism than CD90-CD45RA- mice, and this difference was statistically significant (p=0.02). The 7 fold difference in percent human myeloid cells approached, but did not achieve statistical significance (p=0.08).
Figure 5
Figure 5. Human Lymphoid and Myeloid Cells Reconstitute the Bone Marrow of CD90+CD45RA- Transplanted Mice More Efficiently than CD90-CD45RA-Transplanted Mice
A. Bone marrow engraftment and lineage analysis of CD90/CD45RA transplanted mice 500 FACS-purified CD90+CD45RA- cells (top panels) and CD90-CD45RA- cells (bottom panels) were transplanted into NOG newborn mice as described. 12 weeks later bone marrow was analyzed by flow cytometry for the presence of human CD45+ hematopoietic cells, myeloid cells (hCD45+CD33+), and B lymphoid cells (hCD45+CD19+) cells. The right plots are gated on human CD45+ cells. B. Summary of long-term (> 12 weeks) bone marrow engraftment of CD90/CD45RA subpopulations C. Bone marrow engraftment per 100 transplanted cells The percent human chimerism (left) and percent human myeloid cells (right) per 100 transplanted cells is indicated for each engrafted mouse. Each circle or triangle represents an individual mouse and the bar indicates the average. On average, CD90+CD45RA- mice developed 9 fold more human chimerism than CD90-CD45RA- mice, and this difference was statistically significant (p=0.001). The 9 fold difference in percent human myeloid cells approached, but did not achieve statistical significance (p=0.07). D. Summary of long-term (>11 weeks) bone marrow engraftment of limiting numbers (<100 cells) of CD90/CD45RA subpopulations 50 or 70 double FACS-purified CD90+CD45RA- or CD90-CD45RA- cells were transplanted into NOG newborn mice as described. At least 11 weeks later bone marrow was analyzed by flow cytometry for the presence of human CD45+ hematopoietic cells, myeloid cells (hCD45+CD33+), B cells (hCD45+CD19+) cells, and T cells (hCD45+CD3+). In 1 out of 5 mice transplanted with CD90-CD45RA- cells, a small population of T cells (0.2%) was detected in the bone marrow, in the absence of myeloid and B cells. The difference in successful engraftment was statistically significant (p=0.008).
Figure 6
Figure 6. In Vivo Analysis of Human CD34+ Cells Identifies a Hierarchy Among the CD90/CD45RA Subpopulations
A. Summary of long-term (>12 weeks) human CD34+ bone marrow engraftment of CD90/CD45RA subpopulations B. Bone marrow human CD34+ engraftment per 100 transplanted cells The percentage of human CD34+ cells in total bone marrow per 100 transplanted cells is indicated for each engrafted mouse. Each circle represents an individual mouse and the bar indicates the average. On average, CD90+CD45RA- mice contained 8 fold more human CD34+ cells than CD90-CD45RA- mice, and this difference was statistically significant (p=0.01). C. Analysis of CD90/CD45RA expression on Lin-CD34+CD38- bone marrow cells in CD90/CD45RA transplanted mice 500 FACS-purified CD90+CD45RA- cells (top panels) and CD90-CD45RA- cells (bottom panels) were transplanted into NOG newborn mice as described. 12 weeks later bone marrow was analyzed by flow cytometry for the expression of lineage markers, CD34, CD38, CD90, and CD45RA. The left plots are gated on Lin-CD34+ cells, and the right plots are gated on Lin-CD34+CD38- cells. D. CD90/CD45RA subpopulations within engrafted bone marrow The percentage of CD90+CD45RA- (left), CD90-CD45RA- (middle), and CD90-CD45RA+ (right) cells out of Lin-CD34+CD38- bone marrow cells from mice engrafted with CD90+CD45RA- and CD90-CD45RA- cells is indicated. Each circle, triangle, or square represents an individual mouse. Only mice with greater than 10 Lin-CD34+CD38- cells were included (n=7 transplanted with CD90+CD45RA- cells and n=4 transplanted with CD90-CD45RA- cells).
Figure 7
Figure 7. Enrichment of Secondary Transplant Ability in the CD90+CD45RA Subpopulation
A. Summary of long-term (> 10 weeks) bone marrow engraftment in secondary transplants from mice engrafted with either CD90+ or CD90- subpopulations The difference in successful secondary engraftment, 12 of 12 (100%) for CD90+ versus 3 of 8 (37.5%) for CD90-, was statistically significant with p=0.004. B. Bone marrow engraftment in secondary recipients from experiment 1 Primary mice were transplanted with 2000 cells of the indicated population. The percent human chimerism (left) and percent myeloid cells of total human CD45+ cells (right) is indicated for each secondary mouse. Each circle or triangle represents an individual mouse. C. Bone marrow engraftment in secondary recipients from experiment 2 Primary mice were transplanted with 500 cells of the indicated population. The percent human chimerism (left) and percent myeloid cells of total human CD45+ cells (right) is indicated for each secondary mouse. Each circle or triangle represents an individual mouse.

Similar articles

Cited by

References

    1. Baum CM, Weissman IL, Tsukamoto AS, Buckle AM, Peault B. Isolation of a candidate human hematopoietic stem-cell population. Proc Natl Acad Sci U S A. 1992;89:2804–2808. - PMC - PubMed
    1. Bhatia M, Wang JC, Kapp U, Bonnet D, Dick JE. Purification of primitive human hematopoietic cells capable of repopulating immune-deficient mice. Proc Natl Acad Sci U S A. 1997;94:5320–5325. - PMC - PubMed
    1. Blair A, Hogge DE, Ailles LE, Lansdorp PM, Sutherland HJ. Lack of expression of Thy-1 (CD90) on acute myeloid leukemia cells with long-term proliferative ability in vitro and in vivo. Blood. 1997;89:3104–3112. - PubMed
    1. Bonnet D, Dick JE. Human acute myeloid leukemia is organized as a hierarchy that originates from a primitive hematopoietic cell. Nat Med. 1997;3:730–737. - PubMed
    1. Bryder D, Rossi DJ, Weissman IL. Hematopoietic stem cells: the paradigmatic tissue-specific stem cell. Am J Pathol. 2006;169:338–346. - PMC - PubMed

Publication types