. 2008 Mar 6;2(3):230-40.
doi: 10.1016/j.stem.2008.02.001. Epub 2008 Feb 14.

Defining molecular cornerstones during fibroblast to iPS cell reprogramming in mouse

Affiliations

Defining molecular cornerstones during fibroblast to iPS cell reprogramming in mouse

Matthias Stadtfeld et al. Cell Stem Cell. .

Abstract

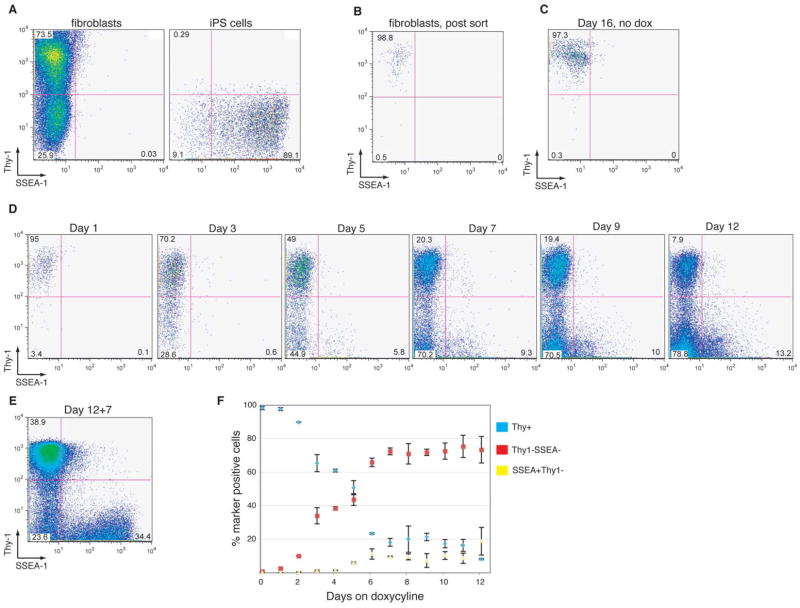
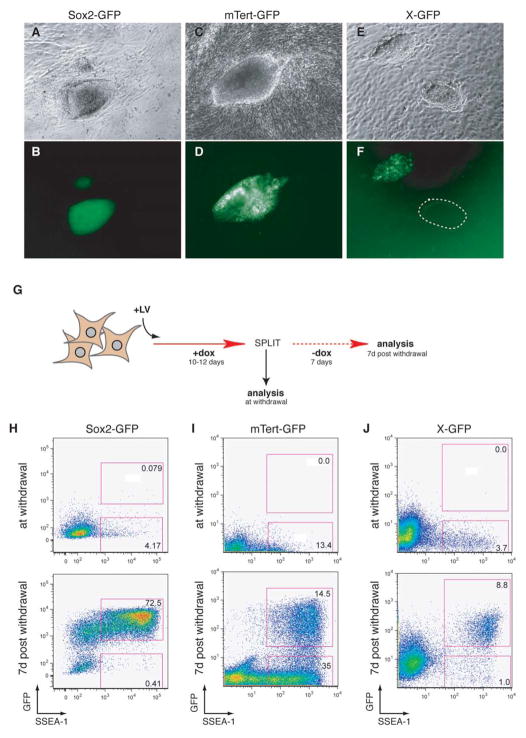
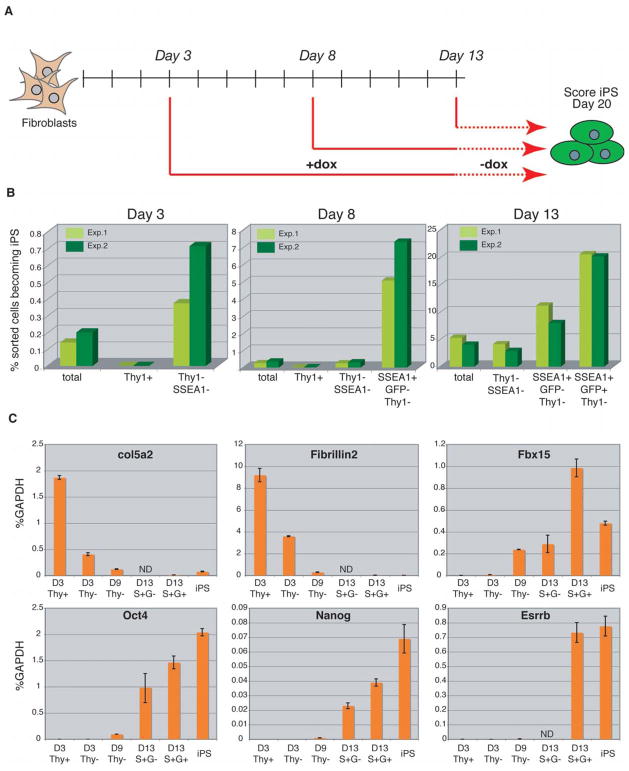
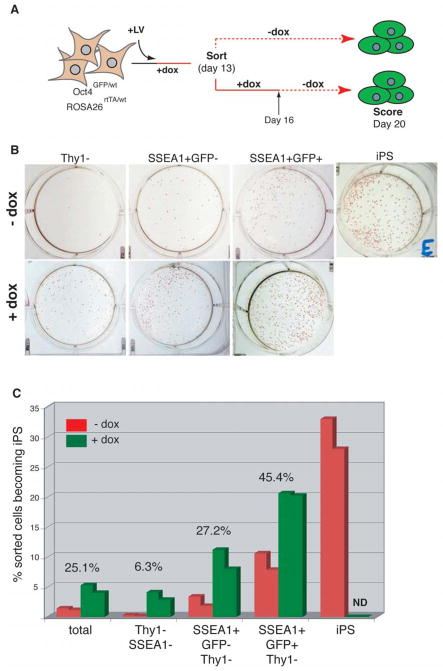
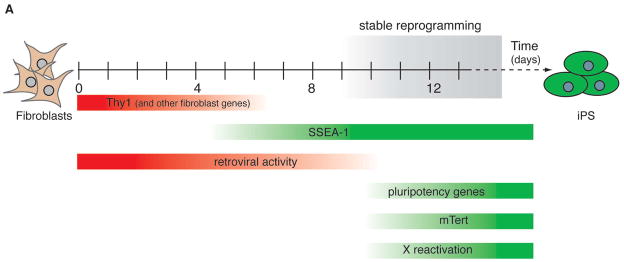
Ectopic expression of the transcription factors Oct4, Sox2, c-Myc, and Klf4 in fibroblasts generates induced pluripotent stem (iPS) cells. Little is known about the nature and sequence of molecular events accompanying nuclear reprogramming. Using doxycycline-inducible vectors, we have shown that exogenous factors are required for about 10 days, after which cells enter a self-sustaining pluripotent state. We have identified markers that define cell populations prior to and during this transition period. While downregulation of Thy1 and subsequent upregulation of SSEA-1 occur at early time points, reactivation of endogenous Oct4, Sox2, telomerase, and the silent X chromosome mark late events in the reprogramming process. Cell sorting with these markers allows for a significant enrichment of cells with the potential to become iPS cells. Our results suggest that factor-induced reprogramming is a gradual process with defined intermediate cell populations that contain the majority of cells poised to become iPS cells.


Figures

Figure 1
Figure 1. Development of a doxycycline-inducible lentiviral system and assessment of the temporal requirement for reprogramming factors
(A) Schematic drawing of the inducible lentivirus containing a doxycycline-controllable promoter (tetOP-CMV) and a unique EcoRI restriction site to insert cDNAs. (B) to (E) Morphology of infected Oct4-GFP tail-tip fibroblasts cultured with doxycycline for 0, 3, 6 and 9 days. Arrow in (C) indicates a microcolony. (F) GFP fluorescence image of colonies shown in (E). Note weakly GFP+ colony (outlined in green) with smooth borders next to a GFP− colony with differentiated appearance (outlined in red). (G) 3-week-old coat color chimera generated from blastocyst injection of iPS cells made with inducible lentiviruses shown left to a non-chimeric littermate. (H) Experimental outline to determine temporal requirement of reprogramming factors. Fibroblasts heterozygous for ROSA26-rtTA and Oct4-GFP alleles were infected with the four lentiviruses (LV), doxycycline (dox) was added for a period of 0–13 days and GFP+ iPS colonies were scored on day 20. (I) Effect of duration of doxycycline expression on the number of GFP+ (green bars) and GFP− (red bars) colonies present at day 20. (J–M) Brightfield and fluorescence images of a representative GFP+ iPS colony (J, K) as well as a GFP− differentiated colony (L, M) at day 20.
Figure 2
Figure 2. Kinetics of Thy1 and SSEA-1 surface antigen expression during reprogramming
(A) FACS plots showing Thy1 and SSEA-1 expression in an established iPS line, respectively. (B) FACS plot of Thy1+ fibroblasts immediately after sorting and (C) after lentiviral infection and culture in the absence of doxycycline for 16 days, demonstrating sort purity and stability of Thy1 expression in the absence of viral gene expression. (D) Representative FACS plots of Thy1 and SSEA-1 expression in infected fibroblasts on days 1, 3, 5, 7, 9 and 12 after doxycycline induction, showing the gradual downregulation of Thy1 and upregulation of SSEA-1. (E) FACS plot of infected fibroblasts cultured for 12 days in the presence of doxycycline and analyzed at 7 days post-withdrawal (12+7). Note the emergence of a SSEAhighThy1− population resembling the phenotype of stable iPS cells shown in (A). (F) Summary of kinetic changes of Thy1 and SSEA-1 expression, indicating the fractions of Thy1+SSEA-1-, Thy1-SSEA-1-, and SSEA-1+Thy1− cells. Voltage settings of the FACS analyzer were not identical between (A) and (C–E) leading to slight differences in the appearances of the depicted populations.
Figure 3
Figure 3. Timing of Sox2-GFP, mTert-GFP, and X-GFP reactivation during reprogramming
(A–F) Brightfield and GFP images of iPS cells derived from Sox2-GFP (A,B), mTert-GFP (C,D), and X-GFP (E,F) fibroblasts. The dotted circle in (F) indicates a colony entirely GFP−, possibly due the loss of one X chromosome. (G) Experimental outline to determine temporal relationship of SSEA-1 expression, GFP marker activation and the appearance of doxycycline-independent iPS cells. Fibroblasts from the different GFP reporter lines were infected with the inducible lentiviruses, cultured in the presence of doxycycline for 10–12 days, and then split equally into two fractions: one fraction was immediately analyzed by flow cytometry and another fraction was analyzed after seven days of culture without doxycycline. (H–J) FACS plots showing GFP and SSEA-1 expression in the cultures at the time of doxycycline withdrawal (upper panels) and at 7 days post-withdrawal (lower panels). Sox2-GFP cells were analyzed with a FACSAria while mTert-GFP and X-GFP cells were analyzed with a FACSCalibur.
Figure 4
Figure 4. Kinetics of retroviral silencing during reprogramming
(A) Experimental outline. Tail fibroblasts heterozygous for ROSA26-M2rtTA and Sox2-GFP alleles were infected with pMX retrovirus expressing the fluorescent protein tdTomato (RV-tdTomato). Thy1+Tomato+ cells were purified by FACS, infected with the four lentiviral factors, cultured in the presence of doxycycline and re-analyzed by FACS at the indicated time. (B) FACS histograms showing the percentages of Tomato+ cells in fibroblasts (Thy1+) and intermediate populations (Thy1-SSEA-1-, SSEA-1+GFP− and SSEA-1+GFP+) 14 days after viral induction. (C) Percentages of Tomato+ cells in fibroblasts and infected subpopulations in the same subpopulations shown in (B) but analyzed at different time points after induction. ND (not determined) indicates lack of that cell population at the respective time point. (D, E) Brightfield image and GFP/Tomato overlay of an early iPS colony that formed after sorting SSEA-1+Tomato+Thy1-GFP− cells at day 8 and seeding them on feeders cells at clonal density. Note the speckled pattern and lack of overlap between Sox2-GFP and retroviral tdTomato expression.
Figure 5
Figure 5. Phenotypically defined subpopulations have different iPS-forming potentials
(A) Experimental outline. Different subpopulations of cells, defined by the expression of Thy1, SSEA-1 and Oct4-GFP or Sox2-GFP, were FACS sorted from fibroblast cultures at the indicated times after factor induction and seeded at equal numbers onto feeder cells. Doxycycline was withdrawn at day 13 and doxycycline-independent GFP+ colonies scored at day 20. (B) Seeding efficiencies of the different subfractions and of unfractionated cultures sorted at the indicated time points are plotted as percentages of sorted cells that formed iPS colonies at day 20. Data from two independent experiments are shown. (C) Graphs showing expression levels of candidate fibroblast (col5a2 and Fibrillin2) and ES cell (Fbx15, Oct4, nanog and Esrrb) markers by qPCR relative to GAPDH. D, day; ND, not determined; S+G-, SSEA-1+GFP−; S+G+, SSEA-1+GFP+; Thy-, Thy1-SSEA-1-.
Figure 6
Figure 6. Correlation between cellular phenotype and degree of reprogramming
A) Experimental outline. Thy1+, Thy1-SSEA-1-, SSEA-1+GFP-Thy1− as well as SSEA-1+GFP+Thy1− cells were sorted from Oct4-GFP fibroblast cultures at day 13 after factor induction. 2,500 cells from each fraction were cultured either in the absence or presence of doxycycline for another 3 days. Doxycycline-independent GFP+ iPS colonies that had formed under either condition were scored at day 20. (B) Images of representative day 20 cultures stained with alkaline phosphatase to demonstrate the colony forming ability of the different subfractions in the absence (upper panel) or presence (lower panel) of doxycycline. A stable iPS line that has been passaged several times is shown for comparison. (C) Graphic representation of the iPS forming potential of the different day 13 subpopulation in the absence (red) or presence (green) of doxycycline, showing two results from two independent experiments for each condition. Percentages above the bars indicate the fraction of colonies that formed in the absence of doxycycline compared with the fraction of colonies that formed in the presence of doxycycline for the different subpopulations.
Figure 7
Figure 7
Kinetics of marker expression during reprogramming.

References

    1. Armstrong L, Lako M, Lincoln J, Cairns PM, Hole N. mTert expression correlates with telomerase activity during the differentiation of murine embryonic stem cells. Mech Dev. 2000;97:109–116. - PubMed
    1. Barklis E, Mulligan RC, Jaenisch R. Chromosomal position or virus mutation permits retrovirus expression in embryonal carcinoma cells. Cell. 1986;47:391–399. - PubMed
    1. Blelloch R, Venere M, Yen J, Ramalho-Santos M. Generation of Induced Pluripotent Stem Cells in the Absence of Selection. Cell Stem Cell. 2007 doi: 10.1016/j.stem.2007.08.008. - DOI - PMC - PubMed
    1. Breault DT, Min IM, Carlone DL, Farilla LG, Henderson DE, Algra S, Montgomery RK, Wagers AJ, Hole N. Generation of mTert-GFP Mice as a Model to Identify and Study Tissue Progenitor Cells. (submitted) - PMC - PubMed
    1. Chambers I, Silva J, Colby D, Nichols J, Nijmeijer B, Robertson M, Vrana J, Jones K, Grotewold L, Smith A. Nanog safeguards pluripotency and mediates germline development. Nature. 2007;450:1230–1234. - PubMed

Publication types

MeSH terms