. 2008 Mar 6;2(3):241-51.
doi: 10.1016/j.stem.2008.01.002.

SIRT1 regulates apoptosis and Nanog expression in mouse embryonic stem cells by controlling p53 subcellular localization

Affiliations

SIRT1 regulates apoptosis and Nanog expression in mouse embryonic stem cells by controlling p53 subcellular localization

Myung-Kwan Han et al. Cell Stem Cell. .

Abstract

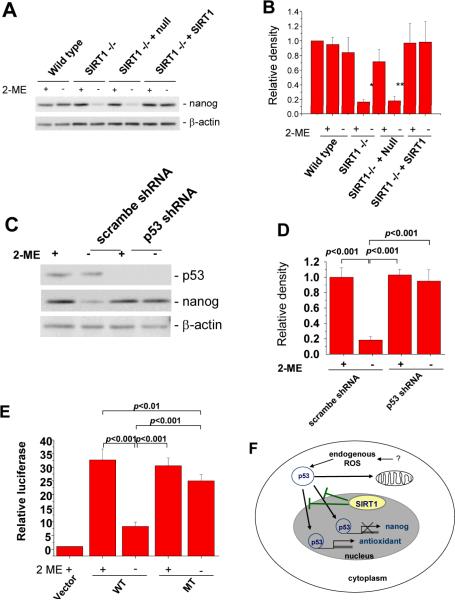
Nuclear tumor suppressor p53 transactivates proapoptotic genes or antioxidant genes depending on stress severity, while cytoplasmic p53 induces mitochondrial-dependent apoptosis without gene transactivation. Although SIRT1, a p53 deacetylase, inhibits p53-mediated transactivation, how SIRT1 regulates these p53 multifunctions is unclear. Here we show that SIRT1 blocks nuclear translocation of cytoplasmic p53 in response to endogenous reactive oxygen species (ROS) and triggers mitochondrial-dependent apoptosis in mouse embryonic stem (mES) cells. ROS generated by antioxidant-free culture caused p53 translocation into mitochondria in wild-type mES cells but induced p53 translocation into the nucleus in SIRT1(-/-) mES cells. Endogenous ROS triggered apoptosis of wild-type mES through mitochondrial translocation of p53 and BAX but inhibited Nanog expression of SIRT1(-/-) mES, indicating that SIRT1 makes mES cells sensitive to ROS and inhibits p53-mediated suppression of Nanog expression. Our results suggest that endogenous ROS control is important for mES cell maintenance in culture.


Figures

Figure 1
Figure 1. 2-ME withdrawal induces intracellular ROS increase by SIRT1-mediated inhibition of the capacity of p53 to enhance expression of antioxidants
(A) Changes of intracellular ROS levels in wild-type and SIRT1−/− mES cells, 24 h after 2-ME withdrawal. ROS levels are expressed as the mean ± SEM of intensity of cell fluorescence. Intracellular ROS was measured by monitoring conversion of DCFH-DA to DCF using FACscan. Expression levels of SIRT1 in wild type and SIRT1−/− mES cells are shown in the insert. *, p<0.005 versus 0 h after 2-ME withdrawal. (B) Histograms for intracellular ROS level in wild-type, SIRT1−/−, and SIRT1−/− mES cells infected with control or SIRT1 expressing lentivirus at 0 and 24 h after 2-ME withdrawal. Expression levels of SIRT1 in SIRT1−/− mES cells infected with control or SIRT1 expressing lentivirus are shown in the insert of right lower panel. (C) Changes of mRNA expression levels of GPX1, SESN1 and SESN2 in wild type and SIRT1−/− mES cells 24 h after 2-ME withdrawal. Expression levels were detected by quantitative real time PCR. Fold changes were calculated from β-actin normalized Ct (threshold cycle) values; error bars represent SD of triplicate experiments. (D) The effect of tiron, an antioxidant, on 2-ME withdrawal induced expression of GPX1, SESN1 and SESN2. SIRT1−/− mES cells were incubated with or without 2-ME in the presence of the indicated dose of Tiron (07#x2013;2 mM). Twelve hours later, mRNA expression levels of GPX1, SESN1 and SESN2 were measured by quantitative real time PCR. Fold changes were calculated from β-actin normalized Ct values; error bars represent SD of triplicate experiments. (E) The expression levels of p53 in scrambled shRNA and p53 shRNA expressing wild and SIRT1−/− mES cells, as detected by western blot. Wild-type and SIRT−/− mES cells were infected with control or p53 shRNA expressing lentiviral particles and selected with 2 μg/ml puromycin. (F) Changes of intracellular ROS levels in scrambled shRNA and p53 shRNA expressing wild-type and SIRT1−/− mES cells 24 h after 2-ME withdrawal. ROS levels are expressed as mean ± SEM of intensity of cell fluorescence. (G) Changes of mRNA expression of GPX1, SESN1 and SESN2 in scrambled shRNA and p53 shRNA expressing SIRT1−/− mES cells, 24 h after 2-ME withdrawal. Expression levels were detected by quantitative real time PCR. Fold changes were calculated from β-actin normalized Ct values; error bars represent SD of triplicate experiments.
Figure 2
Figure 2. SIRT1 controls intracellular translocation of p53 by deacetylation
(A) 2-ME withdrawal-induced nuclear translocation of p53 in SIRT1−/− mES cells. Wild-type, SIRT1−/− and SIRT1−/− mES cells infected with control or SIRT1 expressing lentiviral particles were cultured for 24 h with complete medium in the absence or presence of 2-ME. Cytoplasmic and nuclear fractions were prepared for p53 western blotting. The same blot was probed for β-actin (a control for cytoplasmic fractionation) and PCNA (a control for nuclear fractionation). (B) Ratios of cytosol to nuclear p53 as calculated by the quantification of protein band intensities from triplicate experiments. Error bars represent SD of triplicate experiments. *, p<0.05 versus wild-type mES with 2-ME. (C) Confocal images depicting the nuclear translocation of p53 in SIRT−/− mES removed of 2-ME. Wild-type, SIRT1−/− and SIRT1−/− mES cells infected with control or SIRT1 expressing lentiviral particle were cultured on gelatin coated cover slips for 9 h with complete medium in the absence or presence of 2-ME. The cells were fixed and stained with FITC labeled anti-p53 antibody and 4',6-diamidino-2-phenylindole (DAPI). Images were captured with a confocal microscope. (D) Increase of p53 acetylation in the nuclear fraction of SIRT1−/− mES cells. p53 in cytoplasmic and nuclear fractions of SIRT1−/− mES cells was immunoprecipitated and blotted with anti-p53 antibody and anti-acetyl p53 (lysine 379) antibody. (E) Changes of p21cip1/waf1 and PUMA mRNA expression, 24 h after 2-ME withdrawal, in wild type and SIRT1−/− mES cells. Wild type and SIRT1−/− mES cells were cultured for 24 h with complete medium in the absence or presence of 2-ME. Expression levels were detected by quantitative real time PCR. Fold changes were calculated from β-actin normalized Ct values; error bars represent SD of triplicate experiments. (F) 2-ME withdrawal-induced phosphorylation of p53 at serine 392 in wild-type mES cells. Wild-type mES cells were cultured for 24 h with complete medium in the absence or presence of 2-ME. Whole lysate or mitochondrial fraction in 2 ME withdrawal mES cells was prepared for p53 and phospho-p53 (s392) western blotting.
Figure 3
Figure 3. 2-ME withdrawal induces apoptosis of wild-type, but not SIRT1−/−, mES cells
(A) Western blot analysis of p53 and BAX from mictochondrial fractions, 12 h after 2-ME withdrawal, in wild-type and SIRT1−/− mES cells. Mitochondrial fractions were prepared for p53 and BAX western blotting as described in “Experimental Procedures”. The results of HSP-70 analysis are shown as a marker for mitochondrial fractions. The results of β-actin and PCNA analysis are shown to compare the extend to which the cysolic and nuclear fractions are contaminated. (B) Apoptosis of wild type, SIRT1−/− mES cells and SIRT1−/− mES cells infected with control or SIRT1 expressing lentiviral particles 60 h after 2-ME withdrawal as detected by FACS after Annexin V staining. Error bars represent SD of triplicate experiments. (C) Expression levels of p53 and BAX in scrambled shRNA, p53 shRNA or BAX shRNA expressing wild type mES cells, as detected by western blot analysis. (D) Apoptosis of scrambled shRNA, p53 shRNA or BAX shRNA expressing wild type mES cells 60 h after 2-ME withdrawal as detected by FACS after Annexin V staining. Error bars represent SD of triplicate experiments. Results shown in A–D are for 1 of 3 reproducible experiments with R1 mES cells.
Figure 4
Figure 4. 2-ME withdrawal induces inhibition of Nanog expression
(A) Nanog expression levels in wild type, SIRT1−/− mES cells and SIRT1−/− mES cells infected with control or SIRT1 expressing lentiviral particles upon 2-ME withdrawal, as detected by western blot analysis. Wild-type, SIRT1−/− mES cells and SIRT1−/− mES cells infected with control or SIRT1 expressing lentiviral particles were cultured for 24 h with complete medium in the absence or presence of 2-ME. (B) Relative density of nanog as calculated by β-actin normalized protein band intensities from triplicate experiments. Error bars represent SD of triplicate experiments. *, p<0.01 versus SIRT1−/− mES with 2-ME; **, p<0.05 versus SIRT1−/− + null mES with 2-ME. (C) p53 knockdown blocks 2-ME withdrawal-induced suppression of Nanog expression in SIRT1−/− mES cells. Scrambled shRNA and p53 shRNA expressing SIRT1−/− mES cells were cultured for 24 h with complete medium in the absence or presence of 2-ME. Nanog and p53 levels were detected by western blot. (D) Relative expression of nanog as calculated by β-actin normalized protein band intensities from triplicate experiments. Error bars represent SD of triplicate experiments. (E) 2-ME removal-induced inhibition of Nanog promoter activity and restoration of the activity by mutation of the p53 binding sites in SIRT1−/− mES cells. SIRT1−/− mES cells were transfected with wild type Nanog luciferase and mutant luciferase constructs, cultured for 24 h and then further incubated for 24 h in the absence or presence of 2-ME. Relative luciferase activities of wild type (WT) and mutant (MT) promoters for p53 binding sites are shown. Error bars represent SD of triplicate experiments. (F) Proposed model of SIRT1 role in p53 dependent apoptosis and Nanog expression. SIRT1 blocks nuclear translocation of p53 induced by ROS and triggers mitochondrial dependent apoptosis. SIRT1 also blocks inhibition of the p53 role in suppressing Nanog expression.
Figure 5
Figure 5. Differentiation of SIRT1−/− mES cells cultured in absence of 2-ME
SIRT1−/− mES cells were passaged one time in absence of 2-ME. Alkaline phosphatase was stained as described in Materials and Methods. SSEA-1 and Oct-4 were measured by flow cytometry.

Similar articles

Cited by

References

    1. Aladjem MI, Spike BT, Rodewald LW, Hope TJ, Klemm M, Jaenisch R, Wahl GM. ES cells do not activate p53-dependent stress responses and undergo p53-independent apoptosis in response to DNA damage. Curr. Biol. 1998;8:145–55. - PubMed
    1. Arai M, Yoguchi A, Takizawa T, Yokoyama T, Kanda T, Kurabayashi M, Nagai R. Mechanism of doxorubicin-induced inhibition of sarcoplasmic reticulum Ca2+-ATPase gene transcription. Circ. Res. 2000;86:8–14. - PubMed
    1. Bergamaschi D, Samuels Y, Sullivan A, Zvelebil M, Breyssens H, Bisso A, Del Sal G, Syed N, Smith P, Gasco M, Crook T, Lu X. iASPP preferentially binds p53 proline-rich region and modulates apoptotic function of codon 72-polymorphic p53. Nat. Genet. 2006;38:1133–41. - PubMed
    1. Bordone L, Guarente L. Calorie restriction, SIRT1 and metabolism: understanding longevity. Nat. Rev. Mol. Cell. Biol. 2005;6:298–305. - PubMed
    1. Braithwaite AW, Del Sal G, Lu X. Some p53-binding proteins that can function as arbiters of life and death. Cell Death Differ. 2006;13:984–93. - PubMed

MeSH terms