. 2008 Apr;82(4):949-58.
doi: 10.1016/j.ajhg.2008.02.013. Epub 2008 Mar 27.

Walking the interactome for prioritization of candidate disease genes

Affiliations

Walking the interactome for prioritization of candidate disease genes

Sebastian Köhler et al. Am J Hum Genet. 2008 Apr.

Abstract

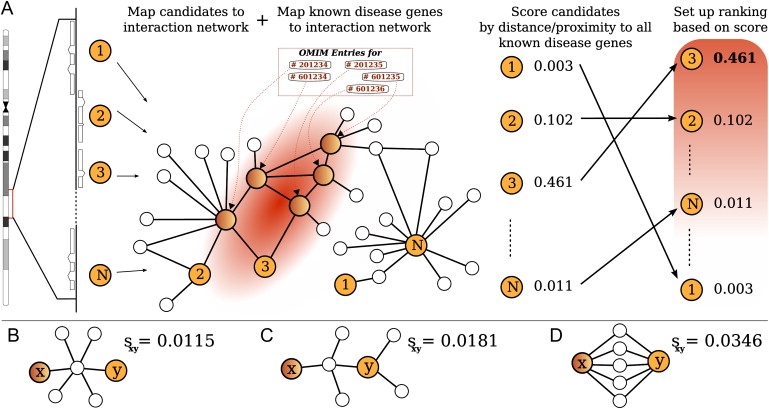
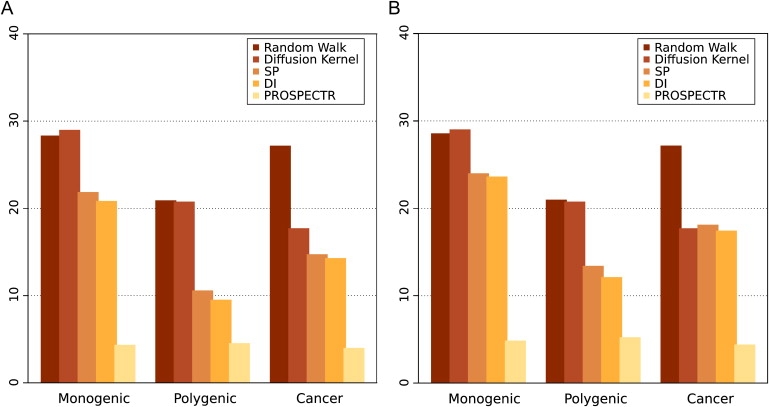
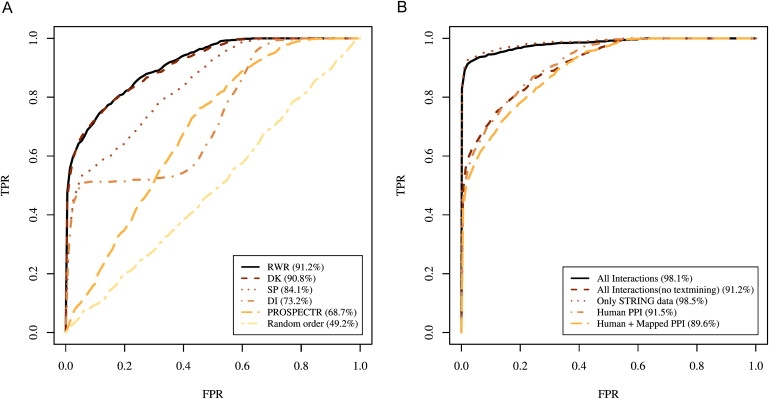
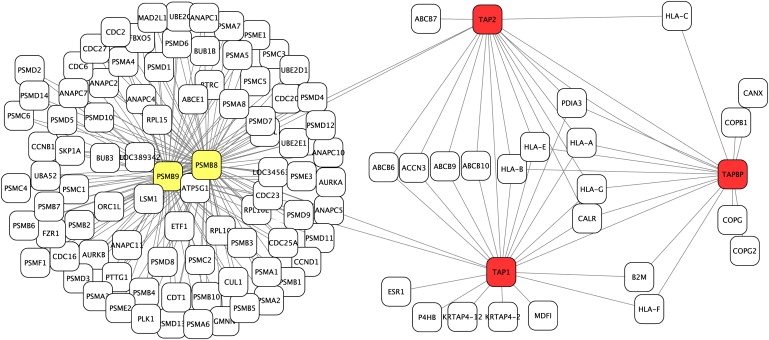
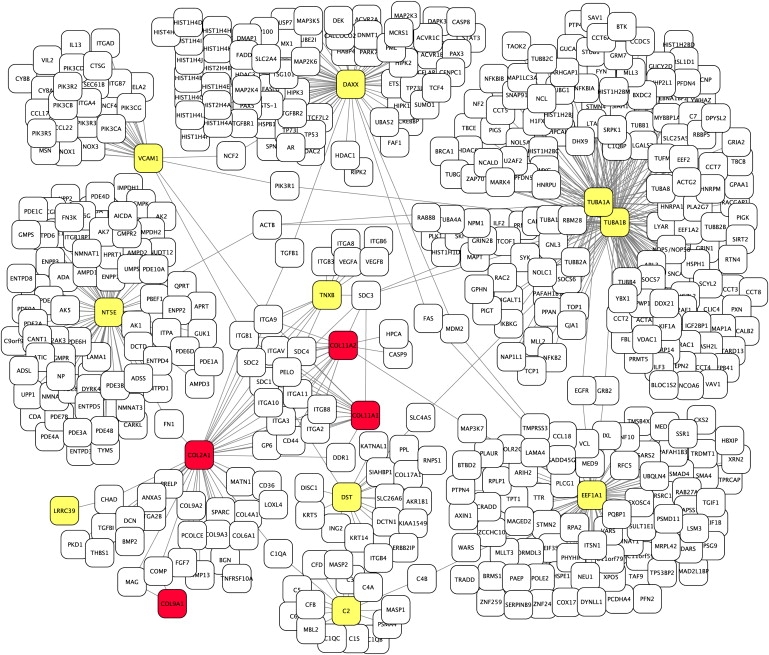
The identification of genes associated with hereditary disorders has contributed to improving medical care and to a better understanding of gene functions, interactions, and pathways. However, there are well over 1500 Mendelian disorders whose molecular basis remains unknown. At present, methods such as linkage analysis can identify the chromosomal region in which unknown disease genes are located, but the regions could contain up to hundreds of candidate genes. In this work, we present a method for prioritization of candidate genes by use of a global network distance measure, random walk analysis, for definition of similarities in protein-protein interaction networks. We tested our method on 110 disease-gene families with a total of 783 genes and achieved an area under the ROC curve of up to 98% on simulated linkage intervals of 100 genes surrounding the disease gene, significantly outperforming previous methods based on local distance measures. Our results not only provide an improved tool for positional-cloning projects but also add weight to the assumption that phenotypically similar diseases are associated with disturbances of subnetworks within the larger protein interactome that extend beyond the disease proteins themselves.


Figures

Figure 1
Figure 1
Disease-Gene Prioritization (A) All candidate genes contained in the linkage interval are mapped to the interaction network, as are all previously known disease genes of the family in question. Our method then assigns a score to each of the candidate genes, with investigation of the relative location of the candidate to all of the known “disease genes” by the use of global network-distance measures. The genes in the linkage interval are ranked according to the score in order to define a priority list of candidates for further biological investigation. (B–D) Each of the three subnetworks displays a different configuration consisting of the same number of nodes. The global distance between a hypothetical disease gene (x) and a candidate gene (y) is different in each case. In (B), proteins x and y are connected via a hub node with many other connections, so that the global similarity (sxy) is less than in (C), where x and y are connected by a protein with fewer connections than those of the hub. On the other hand, nodes that are connected by multiple paths (D) receive a higher similarity than do nodes connected by only one path. Note that the shortest path between x and y is identical in each case (B–D), so that distance measures relying on such local information cannot differentiate between these three types of connection. In particular, the approach taking only direct interactions with gene x into account would identify gene y as a candidate in none of the three cases.
Figure 2
Figure 2
Cross-Validation Results Enrichment analyses for the all-interactions network without STRING text-mining data are shown. Genes within an artificial linkage interval containing 100 genes were ranked according to the methods indicated. The mean enrichment reflects the position of the true disease gene in the prioritized list and is thereby related to the amount of time saved by the sequencing of candidate genes in the order calculated by the respective algorithm (see Material and Methods). Two different methods for evaluating genes with equal scores were evaluated. (A) If multiple genes receive the same score, the worst case is assumed whereby the true disease gene is the last to be sequenced. (B) If multiple genes receive the same score, each gene is given the mean rank of all tied genes. The complete list of results for each disease-gene family is available in Table S2.
Figure 3
Figure 3
Cross-Validation Results Rank ROC curves were generated for the 110 disease-gene families described in this work. The methods used to calculate the individual ROC curves are indicated in the figure. Intuitively, the area under the ROC curve (AUROC) reflects the false-positive rate needed to achieve various levels of sensitivity, with a perfect classifier having an AUROC of 100% and a random classifier having an AUROC of 50%. For comparison, we excluded disease genes with no interaction data, which were 15 genes in the all-data-sources network, 63 genes in the same network without text-mining data, 35 genes in the STRING network, 114 with the human and mapped data, and 139 in the human network. (A) Comparison of different methods for the all-interactions network without STRING text-mining data. The curve labeled “random order” displays the results obtained by the sequencing of genes within the linkage interval at random, i.e., without use of any prioritization method. (B) Comparison of different data sources with RWR analysis.
Figure 4
Figure 4
Bare Lymphocyte Syndrome Type 1 Protein-Interaction Network The protein-interaction network associated with bare lymphocyte syndrome type 1, which comprises the genes TAP1, TAP2, and TAPBP. Each of these genes is shown in red. The DI and SP methods additionally identified the unrelated genes PSMB8 and PSMB9 (shown in yellow) as potential disease genes because they each have an interaction with one of the true disease genes. The RWR method ranks the true disease genes higher because each true disease gene has interactions with two other family members and because there is a dense net of proteins that connect the disease genes via paths with two interactions. All proteins connected to the correct or incorrect candidates by a single interaction are additionally displayed. The graphic was generated with Cytoscape.
Figure 5
Figure 5
Stickler Syndrome Protein-Interaction Network The protein-interaction network associated with Stickler syndrome comprises the genes COL2A1, COL9A1, COL11A1, and COL11A2. There is no direct path between any pair of disease genes. Therefore, the DI method will not make any correct prediction. A number of false predictions of the SP method are shown in yellow. Most of these genes have a large number of direct interactions with other proteins, so that the weight of any single interaction is small in the RWR and DK methods. Each of them has a single path of length 2 with one of the true disease genes. In contrast, the true disease genes each have multiple paths of length 2 with other disease genes and therefore receive a correspondly high score from the RWR and DK methods. For instance, the genes COL11A1, COL11A2, and COL2A1 are connected to one another by 14 other genes. The graphic was generated as in Figure 4.

References

    1. Hamosh A., Scott A.F., Amberger J., Bocchini C., Valle D., McKusick V.A. Online mendelian inheritance in man (OMIM), a knowledgebase of human genes and genetic disorders. Nucleic Acids Res. 2002;30:52–55. - PMC - PubMed
    1. Brunner H.G., van Driel M.A. From syndrome families to functional genomics. Nat. Rev. Genet. 2004;5:545–551. - PubMed
    1. Glazier A.M., Nadeau J.H., Aitman T.J. Finding genes that underlie complex traits. Science. 2002;298:2345–2349. - PubMed
    1. Botstein D., Risch N. Discovering genotypes underlying human phenotypes: past successes for mendelian disease, future approaches for complex disease. Nat. Genet. 2003;33(Suppl):228–237. - PubMed
    1. Perez-Iratxeta C., Bork P., Andrade M.A. Association of genes to genetically inherited diseases using data mining. Nat. Genet. 2002;31:316–319. - PubMed

Publication types