Functional lateralization of face, hand, and trunk representation in anatomically defined human somatosensory areas
- PMID: 18372289
- PMCID: PMC2724832
- DOI: 10.1093/cercor/bhn039
Functional lateralization of face, hand, and trunk representation in anatomically defined human somatosensory areas
Abstract
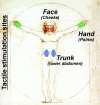
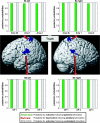
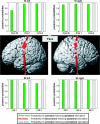
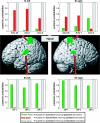
We used functional magnetic resonance imaging (fMRI) and cytoarchitectonic probability maps to investigate the responsiveness of individual areas in the human primary and secondary somatosensory cortices to hand, face, or trunk stimulation of either body-side. A Bayesian modeling approach to quantify the probability of ipsilateral activations revealed that areas OP 1, OP 4, and OP 3 of the SII cortex as well as the trunk and face representations within all SI subareas (areas 3b, 1, and 2) show robust bilateral responses to unilateral stimulation. Such bilateral response properties are in good agreement with the transcallosal projections demonstrated for these areas in nonhuman primates and other mammals. In contrast, the SI hand region showed a different pattern. Whereas ipsilateral areas 3b and 1 were deactivated by tactile hand stimulation, particularly on the left, there was strong evidence for ipsilateral processing of information from the right hand in area 2. These results demonstrate not only the behavioral importance of the hand representation, but also suggest that area 2 may have particularly evolved to form the cortical substrate of these specialized demands, in line with recent studies on cortical evolution hypothesizing that area 2 has developed with increasing manual abilities in anthropoid primates featuring opposable thumbs.
Figures


Similar articles
-
Depicting the inner and outer nose: the representation of the nose and the nasal mucosa on the human primary somatosensory cortex (SI).Hum Brain Mapp. 2014 Sep;35(9):4751-66. doi: 10.1002/hbm.22509. Epub 2014 Mar 21. Hum Brain Mapp. 2014. PMID: 24659451 Free PMC article.
-
The somatotopic organization of cytoarchitectonic areas on the human parietal operculum.Cereb Cortex. 2007 Aug;17(8):1800-11. doi: 10.1093/cercor/bhl090. Epub 2006 Oct 10. Cereb Cortex. 2007. PMID: 17032710
-
Tactile acuity of fingertips and hand representation size in human Area 3b and Area 1 of the primary somatosensory cortex.Neuroimage. 2021 May 15;232:117912. doi: 10.1016/j.neuroimage.2021.117912. Epub 2021 Feb 27. Neuroimage. 2021. PMID: 33652142
-
Bilateral cortical representation of the trunk midline in human first somatic sensory area.Hum Brain Mapp. 2005 Jul;25(3):287-96. doi: 10.1002/hbm.20099. Hum Brain Mapp. 2005. PMID: 15827999 Free PMC article.
-
Functional characterization of human second somatosensory cortex by magnetoencephalography.Behav Brain Res. 2002 Sep 20;135(1-2):141-5. doi: 10.1016/s0166-4328(02)00143-2. Behav Brain Res. 2002. PMID: 12356444 Review.
Cited by
-
Altered functional connectivity differs in stroke survivors with impaired touch sensation following left and right hemisphere lesions.Neuroimage Clin. 2018 Feb 7;18:342-355. doi: 10.1016/j.nicl.2018.02.012. eCollection 2018. Neuroimage Clin. 2018. PMID: 29487791 Free PMC article.
-
Tactile priming modulates the activation of the fronto-parietal circuit during tactile angle match and non-match processing: an fMRI study.Front Hum Neurosci. 2014 Dec 15;8:926. doi: 10.3389/fnhum.2014.00926. eCollection 2014. Front Hum Neurosci. 2014. PMID: 25566010 Free PMC article.
-
Sensory and motor cortical excitability changes induced by rTMS and sensory stimulation in stroke: A randomized clinical trial.Front Neurosci. 2023 Jan 25;16:985754. doi: 10.3389/fnins.2022.985754. eCollection 2022. Front Neurosci. 2023. PMID: 36760794 Free PMC article.
-
Depicting the inner and outer nose: the representation of the nose and the nasal mucosa on the human primary somatosensory cortex (SI).Hum Brain Mapp. 2014 Sep;35(9):4751-66. doi: 10.1002/hbm.22509. Epub 2014 Mar 21. Hum Brain Mapp. 2014. PMID: 24659451 Free PMC article.
-
Providing Evidence for the Null Hypothesis in Functional Magnetic Resonance Imaging Using Group-Level Bayesian Inference.Front Neuroinform. 2021 Dec 2;15:738342. doi: 10.3389/fninf.2021.738342. eCollection 2021. Front Neuroinform. 2021. PMID: 34924989 Free PMC article.
References
-
- Allison T, McCarthy G, Wood CC, Williamson PD, Spencer DD. Human cortical potentials evoked by stimulation of the median nerve. II. Cytoarchitectonic areas generating long-latency activity. J Neurophysiol. 1989;62:711–722. - PubMed
-
- Amunts K, Weiss PH, Mohlberg H, Pieperhoff P, Eickhoff S, Gurd JM, Marshall JC, Shah NJ, Fink GR, Zilles K. Analysis of neural mechanisms underlying verbal fluency in cytoarchitectonically defined stereotaxic space—the roles of Brodmann areas 44 and 45. Neuroimage. 2004;22:42–56. - PubMed
-
- Annett M. Hand preference observed in large healthy samples: classification, norms and interpretations of increased non-right-handedness by the right shift theory. Br J Psychol. 2004;95:339–353. - PubMed
-
- Annett M, Annett J. Handedness for eating in gorillas. Cortex. 1991;27:269–275. - PubMed
-
- Ashburner J, Friston KJ. Rigid body registration. In: Frackowiak RS, Friston KJ, Frith CD, Dolan RJ, Price CJ, Ashburner J, Penny WD, Zeki S, editors. Human brain function. 2nd ed. Oxford (United Kingdom): Academic Press; 2003a. pp. 635–655.
Publication types
MeSH terms
LinkOut - more resources
Full Text Sources
Miscellaneous

