. 2008 Jul;149(7):3500-11.
doi: 10.1210/en.2007-1508. Epub 2008 Mar 27.

Gonadotropin-releasing hormone-1 neuronal activity is independent of hyperpolarization-activated cyclic nucleotide-modulated channels but is sensitive to protein kinase a-dependent phosphorylation

Affiliations

Gonadotropin-releasing hormone-1 neuronal activity is independent of hyperpolarization-activated cyclic nucleotide-modulated channels but is sensitive to protein kinase a-dependent phosphorylation

Stephanie Constantin et al. Endocrinology. 2008 Jul.

Abstract

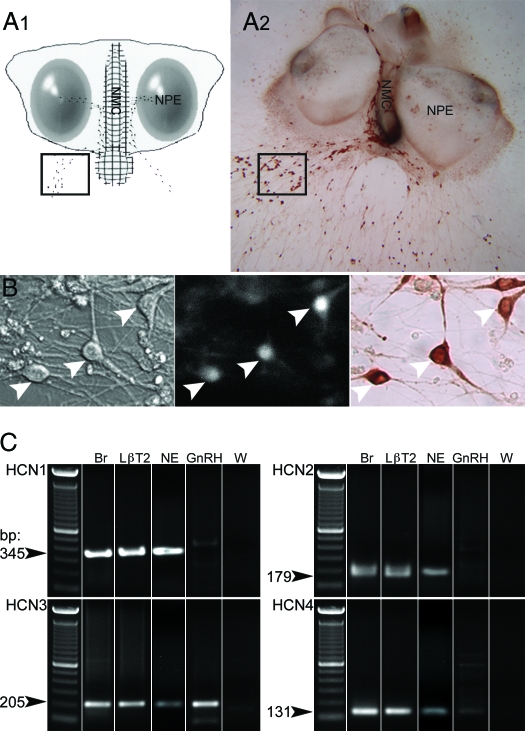
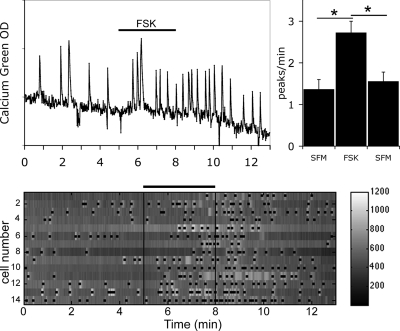
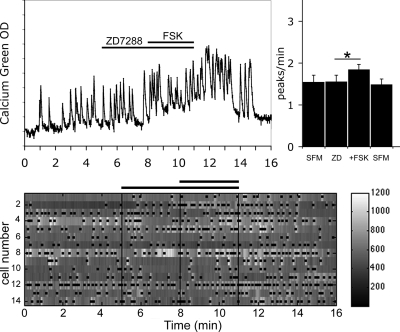
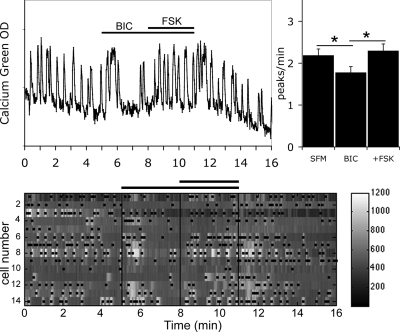
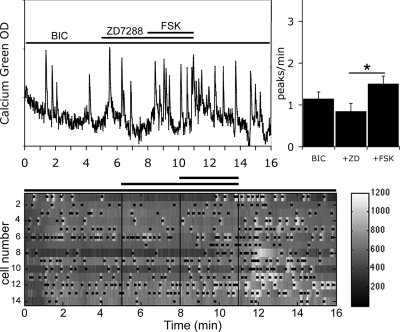
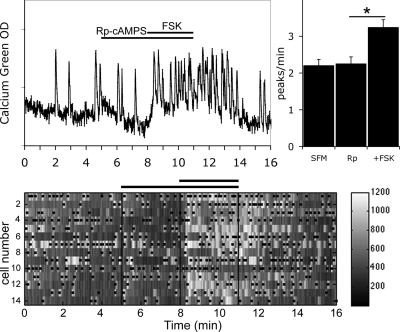
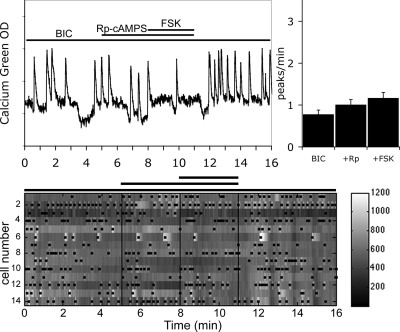
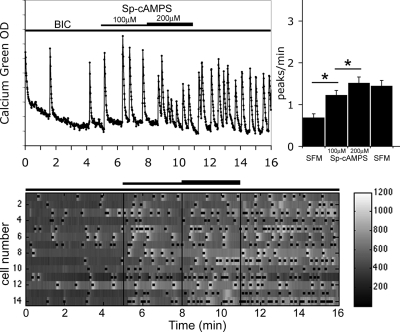
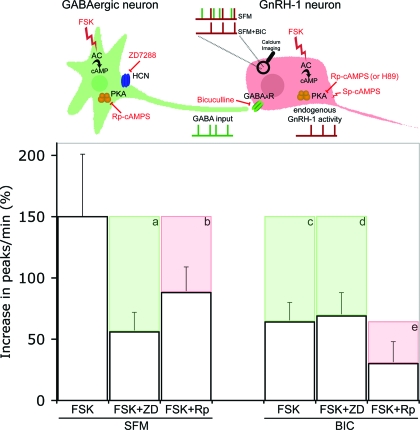
Pulsatile release of GnRH-1 stimulates the anterior pituitary and induces secretion of gonadotropin hormones. GnRH-1 release is modulated by many neurotransmitters that act via G protein-coupled membrane receptors. cAMP is the most ubiquitous effector for these receptors. GnRH-1 neurons express hyperpolarization-activated cyclic nucleotide-modulated (HCN) channel protein in vivo. HCN channels are involved in neuronal pacemaking and can integrate cAMP signals. cAMP-dependent protein kinase (PKA) is also activated by cAMP signals, and PKA-dependent phosphorylation modulates voltage-activated channels. In this report, these two pathways were examined in GnRH-1 neurons as integrators of forskolin (FSK)-induced stimulation. The HCN3 isoform was detected in GnRH-1 neurons obtained from mouse nasal explants. ZD7288, a HCN channel blocker, significantly reduced the efficiency of FSK to stimulate GnRH-1 neurons, whereas blockade of PKA with Rp-adenosine-3',5'-cyclic monophosphorothioate triethylammonium did not attenuate the FSK-induced stimulation. To ensure that disruption of HCN channels on GnRH-1 neurons was responsible for reduction of FSK stimulation, experiments were performed removing gamma-aminobutyric acid (GABA), the major excitatory input to GnRH-1 neurons in nasal explants. Under these conditions, Rp-adenosine-3',5'-cyclic monophosphorothioate triethylammonium, but not ZD7288, altered the FSK-induced response of GnRH-1 neurons. These studies indicate that PKA-dependent phosphorylation is involved in the FSK-induced stimulation of GnRH-1 neurons rather than HCN channels, and HCN channels integrate the FSK-induced stimulation on GABAergic neurons. In addition, blockade of HCN channels did not modify basal GnRH-1 neuronal activity when GABAergic input was intact or removed, negating a role for these channels in basal GABAergic or GnRH-1 neuronal activity.


Figures

Figure 1
Figure 1
Experimental conditions. Calcium imaging recordings were performed on cells maintained in mouse nasal explants for 6–10 div. A1, Schematic showing the structure of a nasal explant obtained from embryonic d-11.5 mouse and maintained 7 div, with nasal pit epithelium (NPE; ovals) and the nasal midline cartilage (NMC; meshed area), surrounded by mesenchyme. GnRH-1 neurons (dots) migrate from NPE and follow olfactory axons to the NMC and off the explant into the periphery. The boxed area delimits a typical field where cells were recorded. A2, A 9-div nasal explant immunostained for GnRH-1 (brown). B, Identified by their bipolar morphology (left panel) and loaded with a calcium-sensitive dye (middle panel), GnRH-1-like cells were recorded. The phenotype of the recorded cells was confirmed a posteriori by immunocytochemistry (right panel, brown). Arrows indicate same cells in all fields. C, Representative gel of PCR products from total nasal explant RT-PCR (NE), single-cell RT-PCR performed on GnRH-1 cells (GnRH) extracted from nasal explant using specific primers for HCN1, HCN2, HCN3, and HCN4 subunits. No bands were detected in GnRH-1 cells with HCN1- or HCN2-specific primers (n = 5). Thirty-five percent of the tested cells (n = 20) exhibited a band with HCN3-specific primers, and a weak band was observed in one of five cells with HCN4-specific primers. Adult brain (Br) and LβT2 cell line (LβT2) showed the expected band, whereas water (W) was negative.
Figure 2
Figure 2
FSK-stimulated GnRH-1 neuronal activity. FSK (1 μm), activator of adenylyl cyclase, induced an increase in calcium oscillations (left panel). Histogram (right panel) shows average peaks per minute (± sem) during the three experimental periods. A significant and reversible increase in calcium peaks in the presence of FSK occurred (*, P < 0.05, Student’s paired t test; N = 3, n = 32). The lower panel shows gray level changes in intracellular calcium in 14 cells simultaneously recorded during the experimental paradigm (SFM-FSK-SFM). Each row represents changes in intracellular calcium in a single cell, and dots mark significant calcium peaks. Lines indicate the time for drug applications as shown on the single-cell trace.
Figure 3
Figure 3
ZD7288 partially abolished FSK-induced stimulation. Recording is from a single cell exposed to ZD7288 (5 μm), inhibitor of HCN channels, followed by FSK (left panel). Treatment with ZD7299 partially prevented the stimulation of GnRH-1 neuronal activity by FSK without altering the endogenous activity (right panel; N = 2, n = 53). The number of peaks per minute is not modified by ZD7288 alone, and in the presence of ZD7288, the number of peaks per minute was still increased by FSK (*, P < 0.05, Student’s paired t test), however the extent of the FSK response was attenuated (compare Figs. 2 and 3). The lower panel shows changes in intracellular calcium in 14 cells simultaneously recorded during the experimental paradigm (SFM-ZD7288-FSK-SFM). Each row represents changes in intracellular calcium in a single cell, and dots mark significant calcium peaks. Lines indicate the time for drug applications as shown on the single-cell trace.
Figure 4
Figure 4
BIC did not prevent FSK-induced stimulation. Recording from a single cell shows that FSK-induced stimulation occurred after removal of endogenous GABAergic inputs (GABAA antagonist BIC; 20 μm, left panel). The number of peaks per minute is significantly decreased by BIC (N = 2, n = 59) and then increased by FSK (*, P < 0.05, Student’s paired t test), showing that GnRH-1 neurons were able to directly integrate FSK-induced signals. The lower panel shows changes in intracellular calcium in 14 cells simultaneously recorded during the experimental paradigm (SFM-BIC-FSK-SFM). Each row represents changes in intracellular calcium in a single cell, and dots mark significant calcium peaks. Lines indicate the time for drug applications as shown on the single-cell trace.
Figure 5
Figure 5
ZD72888 did not block FSK-induced stimulation after blockade of endogenous GABAergic signals. Recording from a single cell shows that in presence of BIC, ZD7288 failed to prevent the FSK-induced stimulation (left panel). The number of peaks per minute was not modified by BIC+ZD in comparison with BIC alone (N = 2, n = 28). In the presence of BIC+ZD, the number of peaks per minute increased by FSK (*, P < 0.05, Student’s paired t test) showing that ZD7288 exerted its blockade on GABAergic neurons rather than GnRH-1 neurons. The lower panel shows changes in intracellular calcium in 14 cells simultaneously recorded during the experimental paradigm (BIC-ZD7288-FSK-BIC). Each row represents changes in intracellular calcium in a single cell, and dots mark significant calcium peaks. Lines indicate the time for drug applications as shown on the single-cell trace.
Figure 6
Figure 6
Rp-cAMPS did not prevent FSK-induced stimulation. Recording from a single cell shows that Rp-cAMPS (10 μm), inhibitor of PKA, did not alter endogenous activity or prevent stimulation of neuronal activity by FSK (left panel). The number of peaks per minute was not modified by Rp alone (N = 3, n = 62), and in the presence of Rp, the number of peaks per minute were still increased by FSK (*, P < 0.05, Student’s paired t test). The lower panel shows changes in intracellular calcium in 14 cells recorded simultaneously during the experimental paradigm (SFM-RpcAMPS-FSK-SFM). Each row represents changes in intracellular calcium in a single cell, and dots mark significant calcium peaks. Lines indicate the time for drug applications as shown on the single-cell trace.
Figure 7
Figure 7
Rp-cAMPS abolished FSK-induced stimulation after blockade of endogenous GABAergic signals. Recording from a single cell shows that in presence of BIC, Rp-cAMPS prevented the FSK-induced stimulation (left panel). The number of peaks per minute was not modified by BIC+Rp in comparison with BIC alone (N = 3, n = 57). However, in the presence of BIC+Rp, the number of peaks per minute did not increase by FSK, revealing the involvement of a PKA-dependent pathway in the integration of FSK-induced signals in GnRH-1 neurons. The lower panel shows changes in intracellular calcium in 14 cells simultaneously recorded during the experimental paradigm (BIC-RpcAMPS-FSK-BIC). Each row represents changes in intracellular calcium in a single cell, and dots mark significant calcium peaks. Lines indicate the time for drug applications as shown on the single-cell trace.
Figure 8
Figure 8
Activation of PKA increased GnRH-1 neuronal activity. Recording from a single cell shows that Sp-cAMPS stimulates calcium oscillations (left panel). The number of peaks per minute was modified by Sp-cAMPS in comparison with SFM (N = 2, n = 19; *, P < 0.05, Student’s paired t test). The lower panel shows changes in intracellular calcium in 14 cells simultaneously recorded during the experimental paradigm (BIC-SpcAMPs-SFM). Each row represents changes in intracellular calcium in a single cell, and dots mark significant calcium peaks. Lines indicate the time for drug application as shown on the single-cell trace.
Figure 9
Figure 9
Summarized data. The upper panel represents the cellular partners evaluated in this study: GnRH-1 neurons (red) with their GABAergic input (green). Independent endogenous electrical activity of GnRH-1 and GABAergic neurons are represented by, respectively, red and green ticked lines under cells. The resulting intracellular calcium oscillations are recorded using calcium imaging, symbolized by a magnifying glass on the GnRH-1 cell body, and are represented by ticked lines above the GnRH-1 cell. Two experimental conditions are represented: SFM, which allows one to record the summation of the two cells’ endogenous activity (green/red), and SFM+BIC, which allows one to record the endogenous GnRH-1 neuronal activity (red). Pharmacological actions are symbolized in red. FSK stimulates AC, ZD7288 (ZD) blocks HCN channels, BIC antagonizes GABAA receptors, Rp-cAMPS (Rp) and H89 block PKA, and Sp-cAMPS stimulates PKA. Histograms show the percent increase in the number of peaks per minute in response to FSK under different experimental conditions. Pharmacological inhibitions are represented by shaded boxes showing loss of response (a–e). When GnRH-1 neurons are driven by GABAergic input (SFM), ZD inhibits the FSK-induced stimulation (a), whereas Rp is not as effective (b). However, in the presence of BIC, ZD fails to block the FSK-induced stimulation (d) in contrast with Rp (e). The inhibition induced by BIC alone (c) reflects the GABAergic contribution to the FSK-induced stimulation (c, green). Note that the inhibition of the FSK response induced by ZD in SFM (a) is similar to that detected after removal of GABAergic input alone (c) and in the presence of BIC+ZD (d). This suggests that in SFM, the inhibition exerted by ZD occurs on HCN channels localized to GABAergic neurons (a, green). The inhibition induced by Rp in BIC (e) can be directly attributed to a PKA-dependent pathway in GnRH-1 neurons (e, red) and likely corresponds to the inhibition observed in SFM (b, red), even though the PKA pathway cannot be totally excluded in GABAergic neurons.

Similar articles

Cited by

References

    1. Herbison AE 2006 Physiology of the gonadotropin-releasing hormone neuronal network. In: Knobil E, Neill J, eds. The physiology of reproduction. 3rd ed. New York: Academic Press; 1415–1482
    1. Ramirez VD, Gallardo E, Hartter D 1980 Factors altering the secretion of LHRH from superfused fragments of rat hypothalamus. J Endocrinol Invest 3:29–37 - PubMed
    1. Bourguignon JP, Franchimont P 1984 Puberty-related increase in episodic LHRH release from rat hypothalamus in vitro. Endocrinology 114:1941–1943 - PubMed
    1. Rasmussen DD 1993 Episodic gonadotropin-releasing hormone release from the rat isolated median eminence in vitro. Neuroendocrinology 58:511–518 - PubMed
    1. Martinez de la Escalera G, Choi AL, Weiner RI 1992 Generation and synchronization of gonadotropin-releasing hormone (GnRH) pulses: intrinsic properties of the GT1-1 GnRH neuronal cell line. Proc Natl Acad Sci USA 89:1852–1855 - PMC - PubMed

Publication types

MeSH terms