

Genome-wide association scan identifies a colorectal cancer susceptibility locus on 11q23 and replicates risk loci at 8q24 and 18q21
- PMID: 18372901
- PMCID: PMC2778004
- DOI: 10.1038/ng.133
Genome-wide association scan identifies a colorectal cancer susceptibility locus on 11q23 and replicates risk loci at 8q24 and 18q21
Abstract
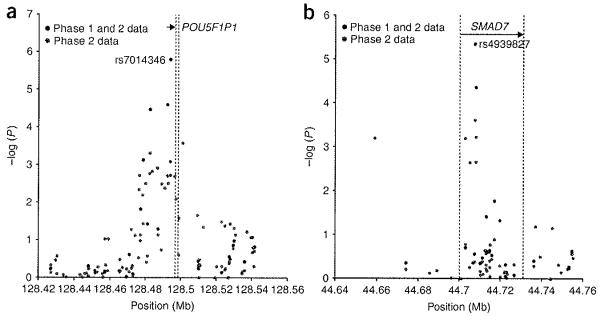
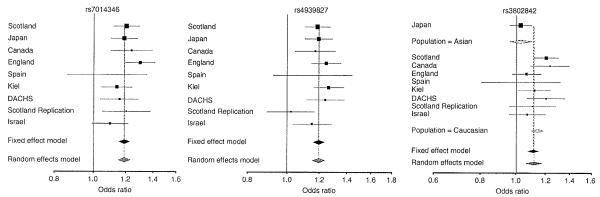
In a genome-wide association study to identify loci associated with colorectal cancer (CRC) risk, we genotyped 555,510 SNPs in 1,012 early-onset Scottish CRC cases and 1,012 controls (phase 1). In phase 2, we genotyped the 15,008 highest-ranked SNPs in 2,057 Scottish cases and 2,111 controls. We then genotyped the five highest-ranked SNPs from the joint phase 1 and 2 analysis in 14,500 cases and 13,294 controls from seven populations, and identified a previously unreported association, rs3802842 on 11q23 (OR = 1.1; P = 5.8 x 10(-10)), showing population differences in risk. We also replicated and fine-mapped associations at 8q24 (rs7014346; OR = 1.19; P = 8.6 x 10(-26)) and 18q21 (rs4939827; OR = 1.2; P = 7.8 x 10(-28)). Risk was greater for rectal than for colon cancer for rs3802842 (P < 0.008) and rs4939827 (P < 0.009). Carrying all six possible risk alleles yielded OR = 2.6 (95% CI = 1.75-3.89) for CRC. These findings extend our understanding of the role of common genetic variation in CRC etiology.
Figures
References
-
- Lichtenstein P, et al. Enviornmental and heritable factors in the causation of cancer - Analyses of cohorts of twins from Sweden, Denmark, and Finland. N. Engl. J. Med. 2000;343:78–85. - PubMed
-
- Barnetson RA, et al. Identification and survival of carriers of multations in DNA mismatch-repair genes in colon cancer. N. Engl. J. Med. 2006;354:2751–2763. - PubMed
-
- Zanke BW, et al. Genome-wide association scan identifies a colorectal cancer susceptibility locus on chromosome 8q24. Nat. Genet. 2007;39:989–994. - PubMed
-
- Tomlinson I, et al. A genome-wide association scan of tag SNPs identifies a susceptibility variant for colorectal cancer at 8q24.21. Nat. Genet. 2007;39:984–988. - PubMed
Publication types
MeSH terms
Grants and funding
- C348/A3758/CRUK_/Cancer Research UK/United Kingdom
- MC_U127527198/MRC_/Medical Research Council/United Kingdom
- R01 CA081488/CA/NCI NIH HHS/United States
- U01 CA074783/CA/NCI NIH HHS/United States
- G0000657-53203/MRC_/Medical Research Council/United Kingdom
- CZB/4/449/CSO_/Chief Scientist Office/United Kingdom
- P30 CA046592/CA/NCI NIH HHS/United States
- A8896/CRUK_/Cancer Research UK/United Kingdom
- U24 CA074783/CA/NCI NIH HHS/United States
- P30 CA46592/CA/NCI NIH HHS/United States
- R01 CA81488/CA/NCI NIH HHS/United States
- U01 CA076783/CA/NCI NIH HHS/United States
- C48/A6361/CRUK_/Cancer Research UK/United Kingdom
- CA-95-011/CA/NCI NIH HHS/United States
- WT_/Wellcome Trust/United Kingdom
LinkOut - more resources
Full Text Sources
Other Literature Sources
Medical
Molecular Biology Databases
