. 2008 Jul 17;27(31):4324-35.
doi: 10.1038/onc.2008.69. Epub 2008 Mar 31.

Alpha-tocopheryl succinate induces apoptosis by targeting ubiquinone-binding sites in mitochondrial respiratory complex II

Affiliations

Alpha-tocopheryl succinate induces apoptosis by targeting ubiquinone-binding sites in mitochondrial respiratory complex II

L-F Dong et al. Oncogene. .

Abstract

Alpha-tocopheryl succinate (alpha-TOS) is a selective inducer of apoptosis in cancer cells, which involves the accumulation of reactive oxygen species (ROS). The molecular target of alpha-TOS has not been identified. Here, we show that alpha-TOS inhibits succinate dehydrogenase (SDH) activity of complex II (CII) by interacting with the proximal and distal ubiquinone (UbQ)-binding site (Q(P) and Q(D), respectively). This is based on biochemical analyses and molecular modelling, revealing similar or stronger interaction energy of alpha-TOS compared to that of UbQ for the Q(P) and Q(D) sites, respectively. CybL-mutant cells with dysfunctional CII failed to accumulate ROS and underwent apoptosis in the presence of alpha-TOS. Similar resistance was observed when CybL was knocked down with siRNA. Reconstitution of functional CII rendered CybL-mutant cells susceptible to alpha-TOS. We propose that alpha-TOS displaces UbQ in CII causing electrons generated by SDH to recombine with molecular oxygen to yield ROS. Our data highlight CII, a known tumour suppressor, as a novel target for cancer therapy.


Figures

Figure 1
Figure 1
ROS generation and induction of apoptosis in cancer cells by α-TOS. ErbB2-low MCF7 and -high MDA-MB-453 cells were exposed to α-TOS at 50 μM and for times shown, and assessed for DHE- (a) and annexin V-positive cells (%) (b). Jurkat cells were treated with 50 μM α-TOS for 2 h or as shown and assessed for ROS accumulation using EPR spectroscopy (c – evaluation of the DMPO-OH adduct level in nmol/mg protein; d – representative EPR spectra of cells exposed to α-TOS in the absence (1) or presence of MitoQ (2) or to MitoQ only (3)). Panel e shows the kinetics of apoptosis induction in Jurkat cells exposed to 50 μM α-TOS in the absence or presence of MitoQ. Control (C) MCF7 parental and ρ0 cells exposed to 50 μM α-TOS for 2 h (T) were assessed for ROS accumulation (f) and apoptosis (g). Where indicated, the cells were pre-treated for 1 h with 2 μM MitoQ (MQ) or co-treated with SOD (PEG-SOD, 750 units/mg). The data shown represent mean values ± S.D. (n=3). The symbol ‘*’ denotes significant difference (p<0.05) in the level of apoptosis and ROS of treated cells compared with the untreated control cell population.
Figure 2
Figure 2
The effect of 3NPA, 3BP, TTFA and α-TOS on the ability of NeuTL cells to reduce MTT. (a) MTT reduction in PBS was assessed after a 4 h co-incubation period in the presence of 3NPA or 3BP used at the concentrations (μM) as shown. (b-d) Cells were pre-incubated for 60 min with MitoQ at the concentrations indicated (Ctrl, 2 or 5 μM; insert box) before addition of 3BP (0-100 μM) (b) and assessed for their ability to reduce MTT after a 2 h incubation period. Cells pre-treated with MitoQ were then treated with TTFA (c) and with α-TOS (d) at the concentration shown, and were assessed for their ability to reduce MTT in RPMI containing 20 mM succinic acid (pH 7.4) after a 2 h incubation period. Results are presented as mean reduction (%) of MTT relative to control (untreated) ± S.D. The symbol ‘*’ denotes significant differences with p<0.05.
Figure 3
Figure 3
Inhibition of SDH/complex II activity in isolated rat liver mitochondria (a, c), and Paracoccus denitrificans (b, d) by α-TOS. Preparations of mitochondria from rat liver or membranes from P. denitrificans were incubated in a reaction mixture facilitating mitochondrial SDH/CII activity (μmol/min/mg protein) and containing DCPIP+PMS. Samples in a and b contained succinate and were both treated with α-TOS as indicated. Dose-response curves displaying changes in the reaction rate (μmol/min) for DCPIP were measured as absorbance at 600 nm under different concentrations of succinate as indicated in the absence or presence of α-TOS (c, d). Results are represented as mean values ± S.D. (n=3). The symbol ‘*’ indicates values significantly different from the controls with p<0.05.
Figure 4
Figure 4
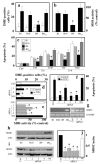
Apoptosis induction by α-TOS is suppressed in CII dysfunctional cells. Parental (B1), CI-dysfunctional (B10), CII-dysfunctional (CybL-mutant; B9), and CybL-mutant cells following complex II reconstitution by transfection with human CybL (B9rec) were exposed to α-TOS 50 μM and for 24 h, unless shown otherwise, harvested and assessed for ROS accumulation (a), SDH activity assessed in whole cells on the basis of MTT reduction with succinate as a substrate (b), and apoptosis (c). MCF7 cells were pre-treated with CybL or non-specific (NS) siRNA, exposed to α-TOS as shown, and assessed for ROS accumulation (d), SDH activity (e), and apoptosis induction (f). Panel g shows results of RT-PCR analysis of B1, B10, B9 or B9rec cells as well as SDHC siRNA-treated MCF7 cells using human SDHC primers. Panel h reveals results of Western blotting of B1, B10, B9 and B9rec cells using monoclonal IgG anti-human SDHC. Western blotting is also shown to document the levels of SDHC in MCF7 cells treated with different SDHC siRNA duplexes and with NS siRNA (i), which was evaluated relative to the actin band (j). Results are represented as mean values ± S.D. (n=3), images are representative of three independent experiments. The symbol ‘*’ indicates values significantly different from the controls with p<0.05.
Figure 5
Figure 5
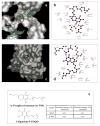
Molecular modelling reveals interaction of α-TOS with UbQ-binding sites in CII. (a) Cut-away view of the QP binding site showing the heme group (bottom left corner) and the position of UbQ (green carbon atoms) as indicated with arrows. The best-fit conformations of UbQ5 (cyan carbons) and α-TOS (orange carbon atoms) are also shown. (b) Ligplot diagram showing the major interactions between the best docked conformation of α-TOS and the QP binding site. (c) View of the proposed QD binding site (with overhanging bridge as a translucent surface) showing the best docked conformations of UbQ5 (cyan carbons) and α-TOS (orange carbons). (d) Ligplot diagram showing the major interactions between the best docked conformation of α-TOS and the QD binding site. (e) Chemical structures of UbQ5 and α-TOS and a table of interaction energies for the best ranked docking conformations for UbQ5 and α-TOS in the QP and QD binding sites. Images in panels a and c were prepared using Astex Viewer (Hartshorn, 2002), while those in panels b and d were prepared using Ligplot (Wallace et al, 1995).
Figure 6
Figure 6
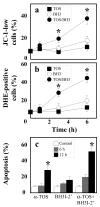
α-TOS causes apoptosis independent of its BH3 mimetic activity. MCF7 cells were treated with 5 μM BH3I-2′ or exposed to 30 μM α-TOS following 10 min pre-treatment with 5 μM BH3I-2′. Cells were then assessed for mitochondrial depolarization (a), ROS generation (b) and apoptosis induction (c). Results are represented as mean values ± S.D. (n=3). The symbol ‘*’ indicates values significantly different from the controls with p<0.05.
Figure 7
Figure 7
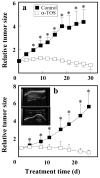
Inhibition of breast cancer in mouse models by α-TOS. (a) Nude mice were inoculated with MCF7 cells and once tumours became established, the animals were treated every 3 d with 10 μmoles per mouse of α-TOS dissolved in DMSO or with DMSO alone, by i.p. injection. Tumour size was measured using callipers and was correlated to the size of the carcinomas at the onset of the therapy. Four animals were used in each group. (b) Female FVB/N c-neu mice with small tumours received either 10 μmoles α-TOS solubilized in corn oil/4% ethanol (n=11) or the excipient alone (control, n=9) by i.p. injection once every 3 d. Tumour size was quantified using USI. Two independent experiments were conducted. The inset in b shows representative images of tumours acquired by USI in the control (upper image) and treated (lower image) FVB/N c-neu mice on day 22 of the experiment. The results shown are mean values ± SEM. The symbol ‘*’ denotes significant differences (p<0.05).
Figure 8
Figure 8
Model for the interference of α-TOS with the mitochondrial electron chain. The scheme shows the proposed effects of α-TOS with the branching of the electron transport chain in its upstream region and clarifies the point of inhibition by α-TOS as specifically interacting with complex II. It also suggests CII as the possible site of superoxide generation, although its precise location within SDH has not been identified. The possible reverse electron transport from CII to CI is also shown.

Similar articles

Cited by

References

    1. Accelrys. InsightII. Accelrys Inc; San Diego: 2001.
    1. Adam-Vizi V, Chinopoulos C. Bioenergetics and the formation of mitochondrial reactive oxygen species. Trends Pharmacol Sci. 2006;27:639–645. - PubMed
    1. Albayrak T, Scherhammer V, Schoenfeld N, Braziulis E, Mund T, Bauer MK, et al. The tumor suppressor cybL, a component of the respiratory chain, mediates apoptosis induction. Mol Biol Cell. 2003;14:3082–3096. - PMC - PubMed
    1. Allen FH. The Cambridge Structural Database: a quarter of a million crystal structures and rising. Acta Crystallogr B. 2002;5:380–388. - PubMed
    1. Allen RG, Balin AK. Effects of oxygen on the antioxidant responses of normal and transformed cells. Exp Cell Res. 2003;289:307–316. - PubMed

Publication types