

Predicting human perceptual decisions by decoding neuronal information profiles
- PMID: 18373103
- PMCID: PMC2799009
- DOI: 10.1007/s00422-008-0226-0
Predicting human perceptual decisions by decoding neuronal information profiles
Abstract
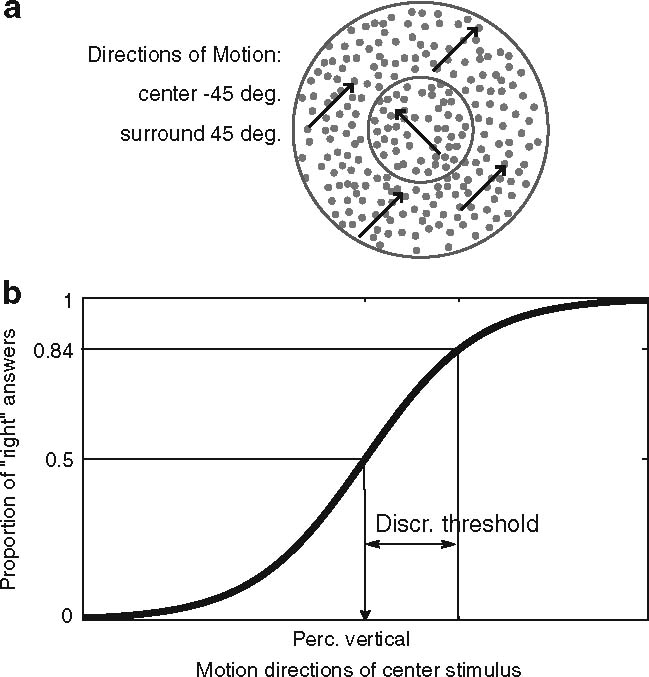
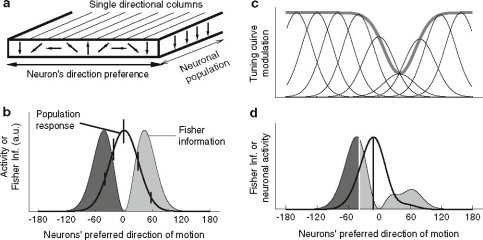
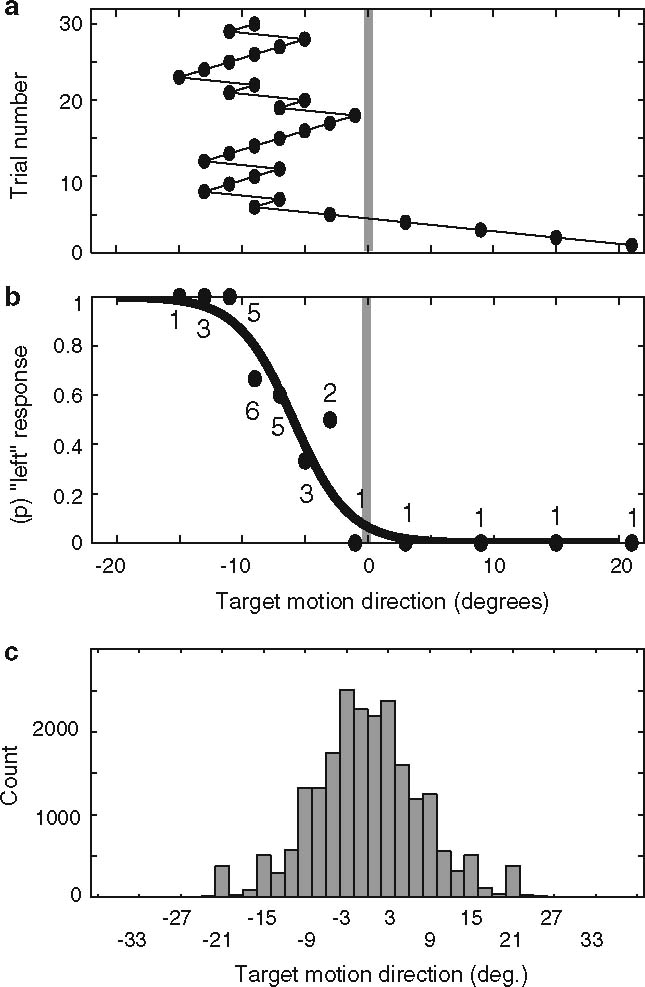
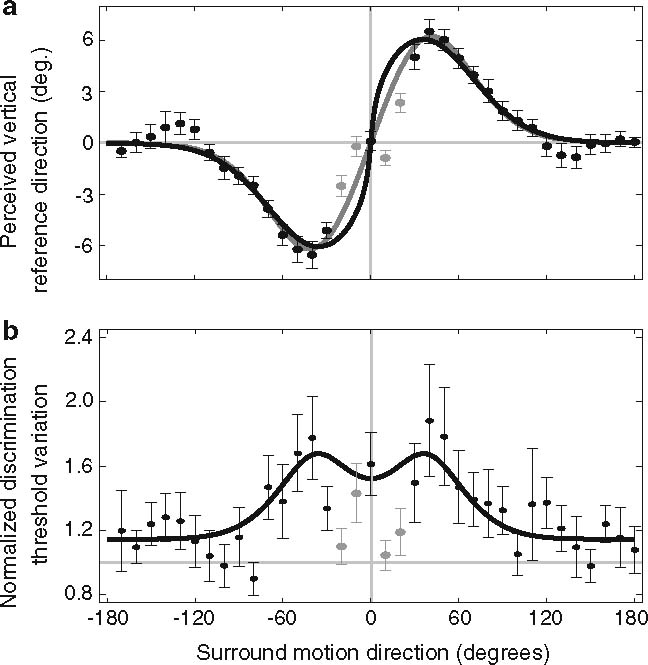
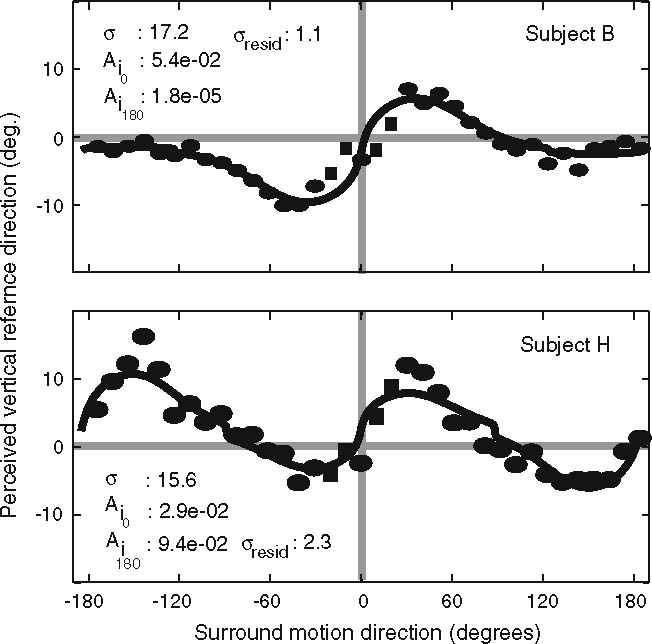
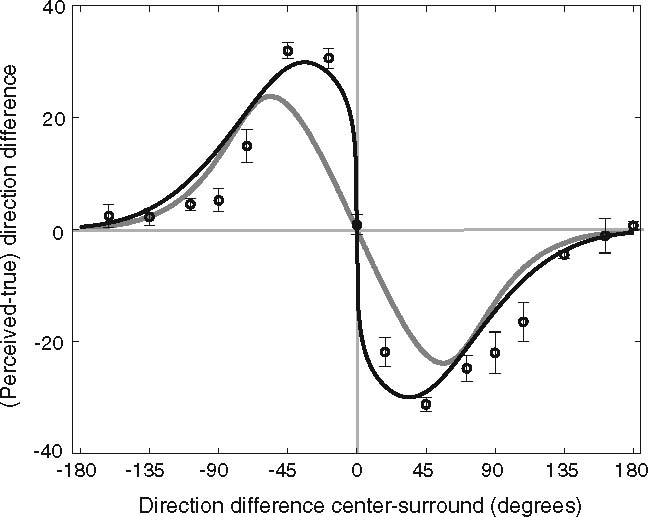
Perception relies on the response of populations of neurons in sensory cortex. How the response profile of a neuronal population gives rise to perception and perceptual discrimination has been conceptualized in various ways. Here we suggest that neuronal population responses represent information about our environment explicitly as Fisher information (FI), which is a local measure of the variance estimate of the sensory input. We show how this sensory information can be read out and combined to infer from the available information profile which stimulus value is perceived during a fine discrimination task. In particular, we propose that the perceived stimulus corresponds to the stimulus value that leads to the same information for each of the alternative directions, and compare the model prediction to standard models considered in the literature (population vector, maximum likelihood, maximum-a-posteriori Bayesian inference). The models are applied to human performance in a motion discrimination task that induces perceptual misjudgements of a target direction of motion by task irrelevant motion in the spatial surround of the target stimulus (motion repulsion). By using the neurophysiological insight that surround motion suppresses neuronal responses to the target motion in the center, all models predicted the pattern of perceptual misjudgements. The variation of discrimination thresholds (error on the perceived value) was also explained through the changes of the total FI content with varying surround motion directions. The proposed FI decoding scheme incorporates recent neurophysiological evidence from macaque visual cortex showing that perceptual decisions do not rely on the most active neurons, but rather on the most informative neuronal responses. We statistically compare the prediction capability of the FI decoding approach and the standard decoding models. Notably, all models reproduced the variation of the perceived stimulus values for different surrounds, but with different neuronal tuning characteristics underlying perception. Compared to the FI approach the prediction power of the standard models was based on neurons with far wider tuning width and stronger surround suppression. Our study demonstrates that perceptual misjudgements can be based on neuronal populations encoding explicitly the available sensory information, and provides testable neurophysiological predictions on neuronal tuning characteristics underlying human perceptual decisions.
Figures

Similar articles
-
Predicting Perceptual Decisions Using Visual Cortical Population Responses and Choice History.J Neurosci. 2019 Aug 21;39(34):6714-6727. doi: 10.1523/JNEUROSCI.0035-19.2019. Epub 2019 Jun 24. J Neurosci. 2019. PMID: 31235648 Free PMC article.
-
Integration of sensory evidence in motion discrimination.J Vis. 2007 Sep 20;7(12):7.1-7. doi: 10.1167/7.12.7. J Vis. 2007. PMID: 17997649 Free PMC article.
-
Linking Neuronal Direction Selectivity to Perceptual Decisions About Visual Motion.Annu Rev Vis Sci. 2020 Sep 15;6:335-362. doi: 10.1146/annurev-vision-121219-081816. Annu Rev Vis Sci. 2020. PMID: 32936737 Review.
-
A model of encoding and decoding in V1 and MT accounts for motion perception anisotropies in the human visual system.Brain Res. 2009 Nov 24;1299:3-16. doi: 10.1016/j.brainres.2009.07.005. Epub 2009 Jul 30. Brain Res. 2009. PMID: 19595992
-
A common neuronal code for perceptual processes in visual cortex? Comparing choice and attentional correlates in V5/MT.Philos Trans R Soc Lond B Biol Sci. 2004 Jun 29;359(1446):929-41. doi: 10.1098/rstb.2003.1415. Philos Trans R Soc Lond B Biol Sci. 2004. PMID: 15306408 Free PMC article. Review.
Cited by
-
Lawful relation between perceptual bias and discriminability.Proc Natl Acad Sci U S A. 2017 Sep 19;114(38):10244-10249. doi: 10.1073/pnas.1619153114. Epub 2017 Sep 5. Proc Natl Acad Sci U S A. 2017. PMID: 28874578 Free PMC article.
-
A single theoretical framework for circular features processing in humans: orientation and direction of motion compared.Front Comput Neurosci. 2012 May 22;6:28. doi: 10.3389/fncom.2012.00028. eCollection 2012. Front Comput Neurosci. 2012. PMID: 22661940 Free PMC article.
-
Spatial precision of population activity in primate area MT.J Neurophysiol. 2015 Aug;114(2):869-78. doi: 10.1152/jn.00152.2015. Epub 2015 Jun 3. J Neurophysiol. 2015. PMID: 26041825 Free PMC article.
-
Moderate acute alcohol intoxication increases visual motion repulsion.Sci Rep. 2018 Jan 25;8(1):1607. doi: 10.1038/s41598-018-19932-8. Sci Rep. 2018. PMID: 29371672 Free PMC article. Clinical Trial.
-
Aging Potentiates Lateral but Not Local Inhibition of Orientation Processing in Primary Visual Cortex.Front Aging Neurosci. 2018 Feb 5;10:14. doi: 10.3389/fnagi.2018.00014. eCollection 2018. Front Aging Neurosci. 2018. PMID: 29459825 Free PMC article.
References
-
- Bonnet C (1986) Manuel pratique de psychophysique. édition U. Armand Colin
-
- Britten K (2003) The visual neurosciences, vol 2, chapter The middle temporal area: motion processing and the link to perception (Chap. 81), pp 1203–216. Massachusetts Institute of Technology, 2003.
Publication types
MeSH terms
LinkOut - more resources
Full Text Sources
