. 2008 May;68(3):600-14.
doi: 10.1111/j.1365-2958.2008.06172.x. Epub 2008 Mar 25.

Small non-coding RNAs in Caulobacter crescentus

Affiliations

Small non-coding RNAs in Caulobacter crescentus

Stephen G Landt et al. Mol Microbiol. 2008 May.

Abstract

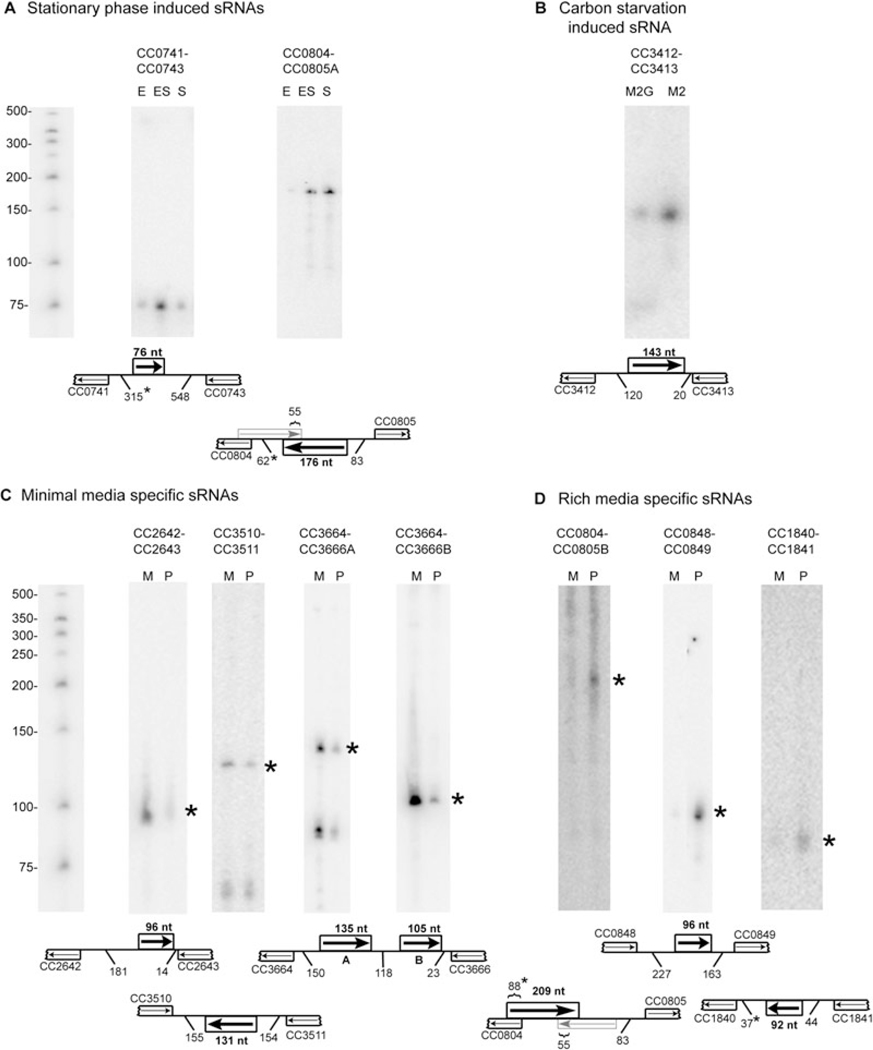
Small non-coding RNAs (sRNAs) are active in many bacterial cell functions, including regulation of the cell's response to environmental challenges. We describe the identification of 27 novel Caulobacter crescentus sRNAs by analysis of RNA expression levels assayed using a tiled Caulobacter microarray and a protocol optimized for detection of sRNAs. The principal analysis method involved identification of sets of adjacent probes with unusually high correlation between the individual intergenic probes within the set, suggesting presence of a sRNA. Among the validated sRNAs, two are candidate transposase gene antisense RNAs. The expression of 10 of the sRNAs is regulated by either entry into stationary phase, carbon starvation, or rich versus minimal media. The expression of four of the novel sRNAs changes as the cell cycle progresses. One of these shares a promoter motif with several genes expressed at the swarmer-to-stalked cell transition; while another appears to be controlled by the CtrA global transcriptional regulator. The probe correlation analysis approach reported here is of general use for large-scale sRNA identification for any sequenced microbial genome.


Figures

Fig. 1.
Fig. 1.
Transcripts identified by probe correlation analysis. A. The transcript analysis of the sRNA between CC2171 and CC2172; (B) shows the transcript analysis of the sRNA between CC1840 and CC1841. In each panel the upper figure shows levels of RNA expression across the indicated intergenic region. The x-axis gives the location in the intergenic region, relative to the final nucleotide in the upstream ORF, of the central (13th) nucleotide in that 25-mer probe. Each differently coloured data set is from the series of probes tiled across the IGR at a different 15 min time point in the cell cycle over 165 min. Arrows indicate experimentally determined transcript boundaries. The middle figure in both panels shows colour coded correlation values, calculated using un-normalized data, for all signal vector-pairs in the indicated IGR. Red denotes high positive correlation, and blue denotes high negative correlation. Vertical black bars indicate transcript boundaries predicted by the correlation analysis. The values below the correlation chart in each panel compare sRNA transcript boundary estimates from the probe correlation analysis with those from 5′ RACE experiments or transcriptional terminator predictions.
Fig. 2.
Fig. 2.
Transposase genes associated with predicted cis-antisense sRNAs. A. Diagrams show a common 144 nucleotide (nt) cis-antisense sRNA adjacent to five independently positioned ISCc2 transposase genes (four of which are expressed from the positive strand and one of which is expressed from the negative strand). In each case, the 144 nt sRNA is 13 nt upstream of the transposase coding region. Below is shown an 84 nt cis-antisense sRNA whose transcript overlaps the IS1111A transposase gene mRNA by 32 nt. Arrows indicate direction of transcription. Sizes of overlapping regions and distances between transcripts are from identified transcriptional start sites (McGrath et al., 2007), indicated by the asterisk, or the predicted start codon of the encoded ORF. Genome locations are in parentheses. B. Northern blots showing expression of cis-antisense sRNAs. DNA markers are shown at left.
Fig. 3.
Fig. 3.
Cell cycle regulated sRNAs. A,C,E,G show cell cycle profiles from the CauloHI1 microarray assay (above) and Northern blots (below) for RNA isolated at indicated times after synchrony, as described in Experimental procedures. In the representation of the microarray data, the Y-axes indicate relative expression levels normalized so that the minimum value is 1. In the Northern blots, sRNA sizes are shown in nucleotides. For the sRNA in the intergenic region between CC1316 and tRNA Asn in (G), the arrow indicates the transcript identified by the probe correlation analysis. B, D, F, H show diagrams of IGRs containing sRNAs. Arrows indicate direction of transcription. The distance in nucleotides between the sRNA and each adjacent gene is indicated, measured as described for Fig. 2. In (D) and (H), the sequences of the sRNAs between CC3552 and CC3555 and between CC1316 and tRNA_Asn are shown, with conserved regulatory motifs boxed. Upstream arrows indicate estimated sRNA transcriptional start sites; downstream arrows show stems of predicted rho-independent terminator hairpins. Motif cc_10 is the consensus binding site for CtrA (Quon et al., 1996; McGrath et al., 2007). (I) shows a schematic of the C. crescentus cell cycle. Grey shading indicates times when CtrA is present during the cell cycle (Quon et al., 1996; Domian et al., 1997).
Fig. 4.
Fig. 4.
sRNAs expressed under specific growth conditions. A. Two sRNAs were induced by entry into stationary phase. E, RNA isolated from cells grown in M2G media in exponential phase; ES, from cells in early stationary phase (OD = 1.0); S, from cells incubated an additional 24 h after reaching OD = 1.0. B. The expression of a sRNA induced by carbon starvation. M2 indicates RNA taken from cells grown in M2G media, then washed and re-suspended in M2 media (M2G lacking glucose) and incubated for another 10 min. M2G indicates RNA taken from cells treated identically but washed and re-suspended in M2G media for the same amount of time. C and D. Four sRNAs were upregulated in minimal media with glucose as the sole carbon source (C). Three sRNAs were upregulated in rich PYE media (D). M, RNA isolated from cells in exponential phase grown in M2G minimal media; P, RNA isolated from cells in exponential phase grown in PYE rich media. Asterisks indicate the sRNA bands on the Northern blots that are consistent with predictions made by probe correlation analysis in conjunction with 5′ RACE and Transterm terminator predictions. DNA markers are shown at left. Schematics are as described in Fig. 3.
Fig. 5.
Fig. 5.
Northern blots of constitutively expressed sRNAs. RNA was isolated from cells grown in M2G minimal media. Asterisks indicate sRNA bands consistent with boundary predictions made by correlation analysis in conjunction with 5′ RACE and Transterm terminator predictions (Table 1 and Table S2). DNA markers are shown at left. Arrows indicate direction of transcription.

Similar articles

Cited by

References

    1. Alvarez-Martinez CE, Lourenco RF, Baldini RL, Laub MT, and Gomes SL (2007) The ECF sigma factor sigma(T) is involved in osmotic and oxidative stress responses in Caulobacter crescentus. Mol Microbiol 66: 1240–1255. - PubMed
    1. Antal M, Bordeau V, Douchin V, and Felden B. (2005) A small bacterial RNA regulates a putative ABC transporter. J Biol Chem 280: 7901–7908. - PubMed
    1. Argaman L, Hershberg R, Vogel J, Bejerano G, Wagner EG, Margalit H, and Altuvia S. (2001) Novel small RNA-encoding genes in the intergenic regions of Escherichia coli. Curr Biol 11: 941–950. - PubMed
    1. Arini A, Keller MP, and Arber W. (1997) An antisense RNA in IS30 regulates the translational expression of the transposase. Biol Chem 378: 1421–1431. - PubMed
    1. Babitzke P, and Romeo T. (2007) CsrB sRNA family: sequestration of RNA-binding regulatory proteins. Curr Opin Microbiol 10: 156–163. - PubMed

Publication types

MeSH terms