. 2008 Jul;106(1):299-312.
doi: 10.1111/j.1471-4159.2008.05383.x. Epub 2008 Jul 1.

Lipidomic analysis and electron transport chain activities in C57BL/6J mouse brain mitochondria

Affiliations

Lipidomic analysis and electron transport chain activities in C57BL/6J mouse brain mitochondria

Michael A Kiebish et al. J Neurochem. 2008 Jul.

Abstract

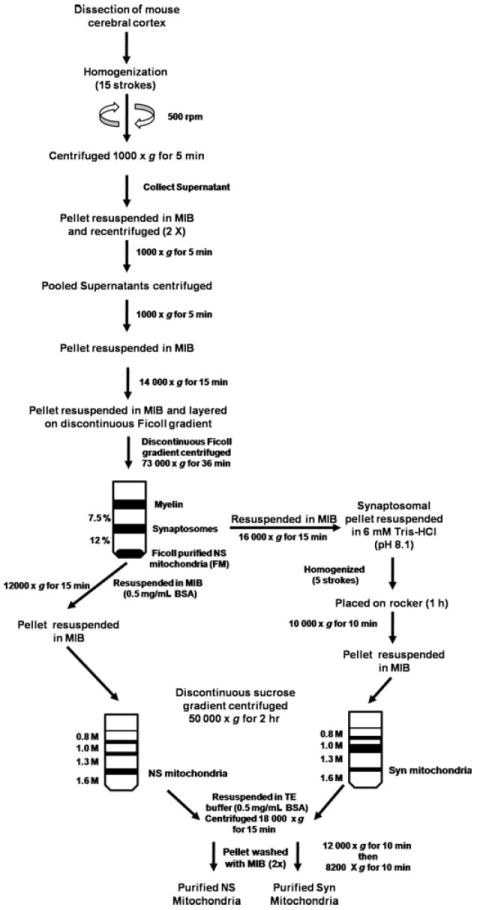
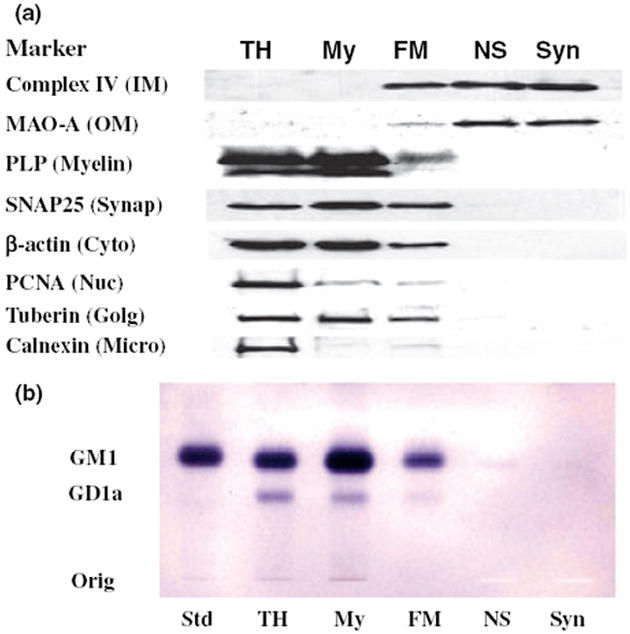
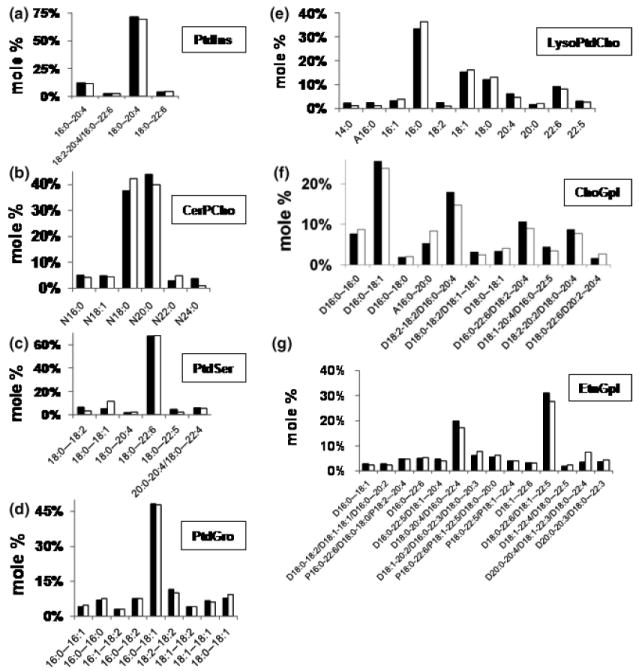
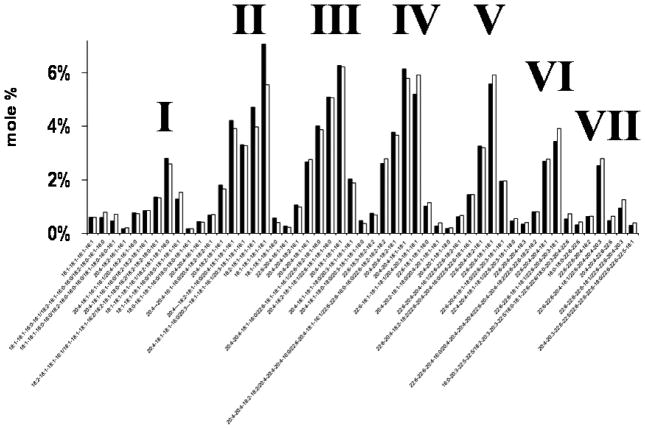
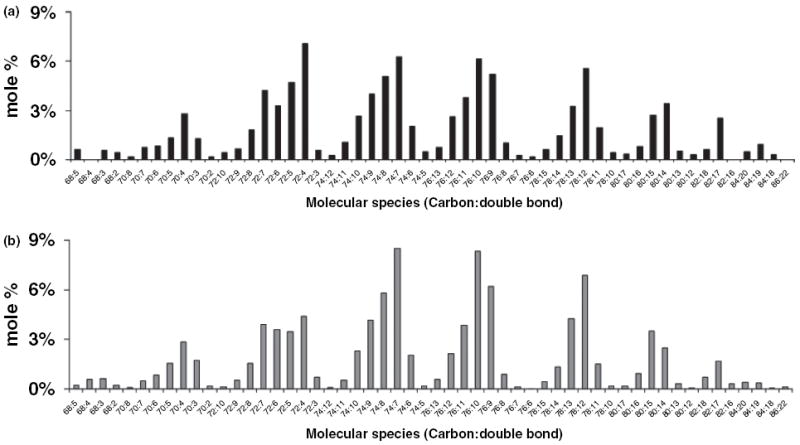
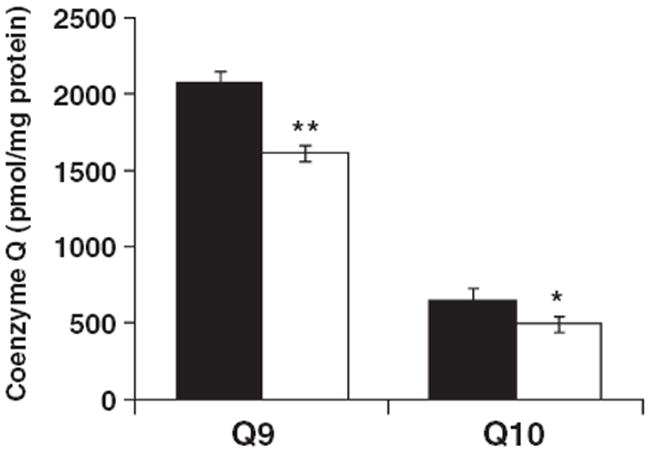
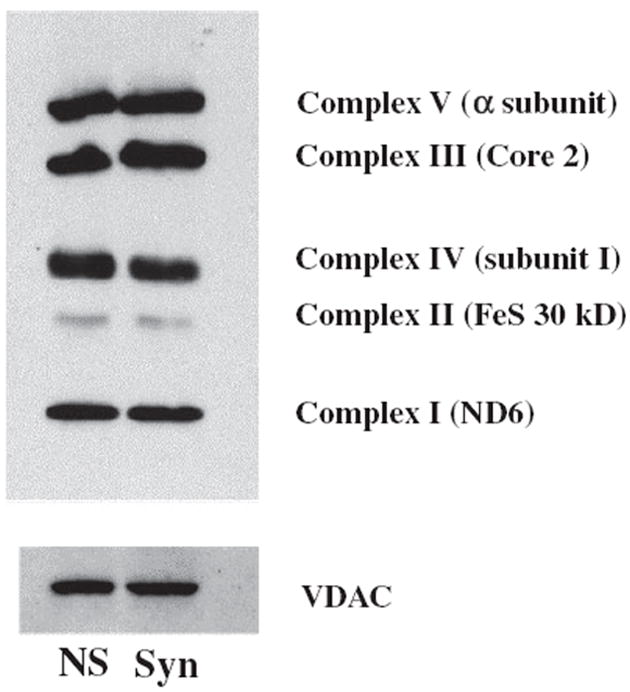
The objective of this study was to characterize the lipidome and electron transport chain activities in purified non-synaptic (NS) and synaptic (Syn) mitochondria from C57BL/6J mouse cerebral cortex. Contamination from subcellular membranes, especially myelin, has hindered past attempts to accurately characterize the lipid composition of brain mitochondria. An improved Ficoll and sucrose discontinuous gradient method was employed that yielded highly enriched mitochondrial populations free of myelin contamination. The activities of Complexes I, II, III, and II/III were lower in Syn than in NS mitochondria, while Complexes I/III and IV activities were similar in both populations. Shotgun lipidomics showed that levels of cardiolipin (Ptd(2)Gro) were lower, whereas levels of ceramide and phosphatidylserine were higher in Syn than in NS mitochondria. Coenzyme Q(9) and Q(10) was also lower in Syn than in NS mitochondria. Gangliosides, phosphatidic acid, sulfatides, and cerebrosides were undetectable in brain mitochondria. The distribution of Ptd(2)Gro molecular species was similar in both populations and formed a unique pattern, consisting of seven major molecular species groups, when arranged according to mass to charge ratios. Remodeling involving choline and ethanolamine phosphoglycerides could explain Ptd(2)Gro heterogeneity. NS and Syn mitochondrial lipidomic heterogeneity could influence energy metabolism, which may contribute to metabolic compartmentation of the brain.


Figures

Fig. 1
Fig. 1
Procedure used for the isolation and purification of NS and Syn mitochondria from mouse cerebral cortex.
Fig. 2
Fig. 2
Distribution of protein markers on western blots (a) and of gangliosides on TLC (b) in subcellular fractions from mouse cerebral cortex. Subcellular fractions included total homogenate (TH), crude myelin (My), Ficoll gradient purified NS mitochondria (FM), Ficoll and sucrose gradient purified non-synaptic mitochondria (NS), and Ficoll and sucrose gradient purified synaptic mitochondria (Syn). Western blots were performed to determine the distribution of specific protein markers for the inner mitochondria membrane (Complex IV, subunit IV), outer mitochondrial membrane (monoamine oxidase-A), myelin (proteolipid protein), synaptosomal membrane (SNAP25), cytoskeleton (β-actin), nuclear membrane (proliferating cell nuclear antigen), Golgi membrane (tuberin), and microsomal membrane (calnexin). GM1a was visualized on TLC plates with cholera toxin b immunostaining as described in Materials and methods. Std, is GM1a.
Fig. 3
Fig. 3
Distribution of fatty acid molecular species in NS (black bar) and Syn (white bar) mitochondrial phospholipids. Phospholipids included (a) phosphatidylinositol (PtdIns), (b) sphingomyelin (CerPCho), (c) phosphatidylserine (PtdSer), (d) phosphatidylglycerol (PtdGro), (e) lysophosphatidylcholine (LysoPtdCho), (f) choline glycerophospholipids (ChoGpl), and (g) ethanolamine glycerophospholipids (EtnGpl). Molar percentages less than 2% of the total lipid are not shown. Glycerolipid subclasses include D (phosphatidyl), P (plasmenyl), and A (plasmanyl). The total molecular species content of each lipid class is presented in supplementary Tables S1–S9. All values are expressed as the mean of three independent samples (n = 3), where six cortexes were pooled for each sample.
Fig. 4
Fig. 4
Distribution of Ptd2Gro molecular species in NS (black bar) and Syn (white bar) mitochondria. Ptd2Gro molecular species were arranged according to the mass to charge ratio based on percentage distribution. Ptd2Gro molecular species were subdivided into seven groups, which contained a predominance of oleic, arachidonic, and/or docosahexanoic fatty acids in varying concentrations. Corresponding mass content of molecular species in NS and Syn mitochondria can be found in supplementary Table S3. All values are expressed as the mean of three independent samples (n = 3), where six cortexes were pooled for each sample.
Fig. 5
Fig. 5
Mathematical prediction of the distribution of brain cardiolipin molecular species. (a) Distribution of molecular species of NS brain Ptd2Gro as determined by shotgun lipidomics. (b) Distribution of molecular species of Ptd2Gro as determined by mathematical modeling as described in Materials and methods.
Fig. 6
Fig. 6
Coenzyme Q9 and Q10 content in NS (black bar) and Syn (white bar) mitochondria. Coenzyme Q content was measured by HPLC connected to an electrochemical detector as described in Materials and methods. The content of Q9 and Q10 were significantly lower in Syn mitochondria compared with NS mitochondria. Values are expressed as the mean pmol/mg protein ± SD (n = 3), where six cortexes were pooled for each sample. Asterisks indicate that the Q9 and Q10 values were lower in the Syn mitochondria than in the NS mitochondria at *p < 0.02 and **p < 0.001.
Fig. 7
Fig. 7
Expression of ETC protein markers in NS and Syn mitochondria. Representative protein markers for each of the five ETC complexes were evaluated by western blot as described in Materials and methods. This pattern is representative of expression found from three separate isolations, where six cortexes were pooled for each sample. ETC protein expression was evaluated at least three times to confirm accuracy of data. Voltage-dependent anion channel (VDAC) was used as a loading control for mitochondrial protein.

Similar articles

Cited by

References

    1. Bangur CS, Howland JL, Katyare SS. Thyroid hormone treatment alters phospholipid composition and membrane fluidity of rat brain mitochondria. Biochem J. 1995;305:29–32. - PMC - PubMed
    1. Battino M, Bertoli E, Formiggini G, Sassi S, Gorini A, Villa RF, Lenaz G. Structural and functional aspects of the respiratory chain of synaptic and nonsynaptic mitochondria derived from selected brain regions. J Bioenerg Biomembr. 1991;23:345–363. - PubMed
    1. Battino M, Gorini A, Villa RF, Genova ML, Bovina C, Sassi S, Littarru GP, Lenaz G. Coenzyme Q content in synaptic and non-synaptic mitochondria from different brain regions in the ageing rat. Mech Ageing Dev. 1995;78:173–187. - PubMed
    1. Bayir H, Tyurin VA, Tyurina YY, et al. Selective early cardiolipin peroxidation after traumatic brain injury: an oxidative lipidomics analysis. Ann Neurol. 2007;62:154–169. - PubMed
    1. Bedell MA, Jenkins NA, Copeland NG. Mouse models of human disease Part I: techniques and resources for genetic analysis in mice. Genes Dev. 1997a;11:1–10. - PubMed

Publication types