

Locating suitable habitats for West Nile Virus-infected mosquitoes through association of environmental characteristics with infected mosquito locations: a case study in Shelby County, Tennessee
- PMID: 18373868
- PMCID: PMC2322965
- DOI: 10.1186/1476-072X-7-12
Locating suitable habitats for West Nile Virus-infected mosquitoes through association of environmental characteristics with infected mosquito locations: a case study in Shelby County, Tennessee
Abstract
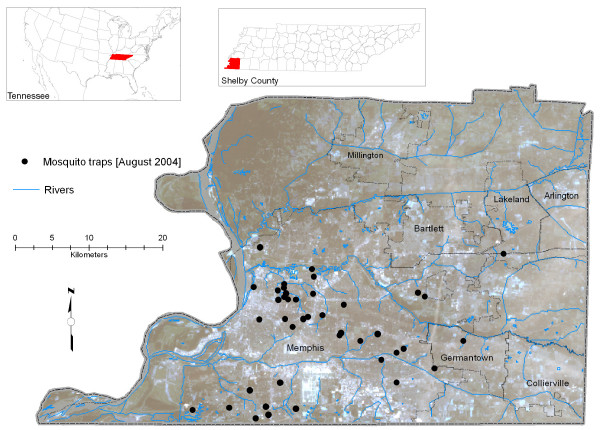
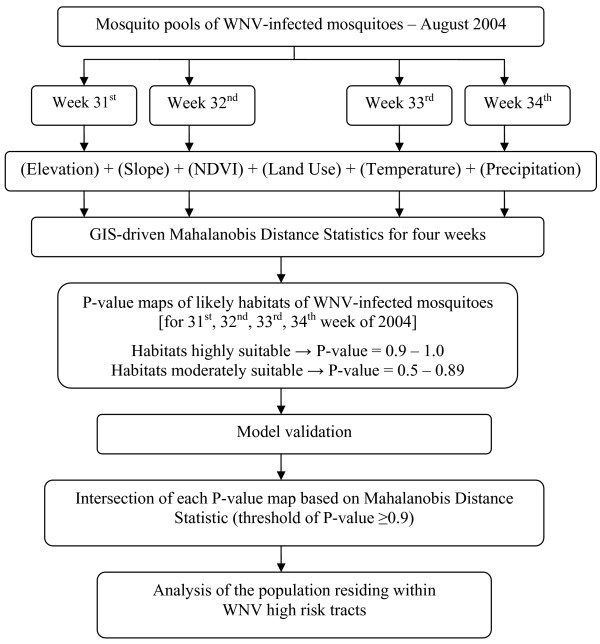
Background: Since its first detection in 2001, West Nile Virus (WNV) poses a significant health risk for residents of Shelby County in Tennessee. This situation forced public health officials to adopt efficient methods for monitoring disease spread and predicting future outbreaks. Analyses that use environmental variables to find suitable habitats for WNV-infected mosquitoes have the potential to support these efforts. Using the Mahalanobis Distance statistic, we identified areas of Shelby County that are ecologically most suitable for sustaining WNV, based on similarity of environmental characteristics to areas where WNV was found. The environmental characteristics in this study were based on Geographic Information Systems (GIS) data, such as elevation, slope, land use, vegetation density, temperature, and precipitation.
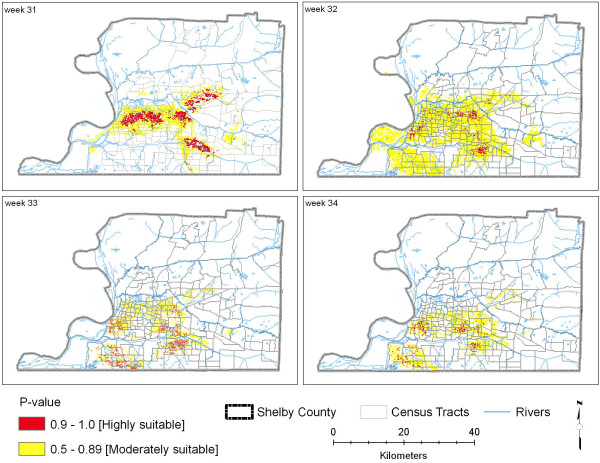
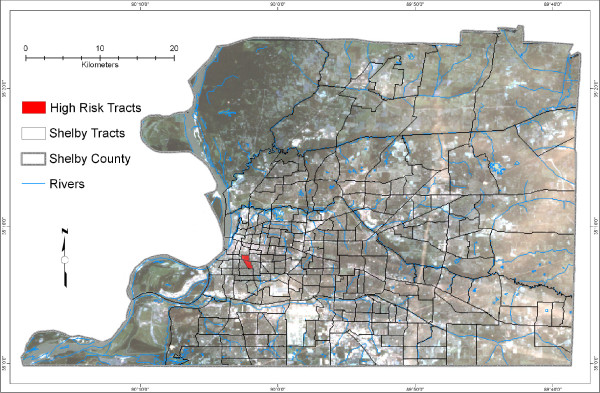
Results: Our analyses produced maps of likely habitats of WNV-infected mosquitoes for each week of August 2004, revealing the areas that are ecologically most suitable for sustaining WNV within the core of the Memphis urban area. By comparing neighbourhood social characteristics to the environmental factors that contribute to WNV infection, potential social drivers of WNV transmission were revealed in Shelby County. Results show that human population characteristics and housing conditions such as a high percentage of black population, low income, high rental occupation, old structures, and vacant housing are associated with the focal area of WNV identified for each week of the study period.
Conclusion: We demonstrated that use of the Mahalanobis Distance statistic as a similarity index to assess environmental characteristics is a potential raster-based approach to identify areas ecologically most suitable for sustaining the virus. This approach was also useful to monitor changes over time for likely locations of infected mosquito habitats. This technique is very helpful for authorities when making decisions related to an integrated mosquito management plan and targeted health education outreach.
Figures
Similar articles
-
Rapid GIS-based profiling of West Nile virus transmission: defining environmental factors associated with an urban-suburban outbreak in Northeast Ohio, USA.Geospat Health. 2008 May;2(2):215-25. doi: 10.4081/gh.2008.245. Geospat Health. 2008. PMID: 18686270 Free PMC article.
-
Surveillance of above- and below-ground mosquito breeding habitats in a rural midwestern community: baseline data for larvicidal control measures against West Nile Virus vectors.Clin Med Res. 2005 Feb;3(1):3-12. doi: 10.3121/cmr.3.1.3. Clin Med Res. 2005. PMID: 15962015 Free PMC article.
-
Modeling and Surveillance of Reporting Delays of Mosquitoes and Humans Infected With West Nile Virus and Associations With Accuracy of West Nile Virus Forecasts.JAMA Netw Open. 2019 Apr 5;2(4):e193175. doi: 10.1001/jamanetworkopen.2019.3175. JAMA Netw Open. 2019. PMID: 31026036 Free PMC article.
-
The global ecology and epidemiology of West Nile virus.Biomed Res Int. 2015;2015:376230. doi: 10.1155/2015/376230. Epub 2015 Mar 19. Biomed Res Int. 2015. PMID: 25866777 Free PMC article. Review.
-
West Nile virus and the threat to the UK.Commun Dis Public Health. 2002 Jun;5(2):138-43. Commun Dis Public Health. 2002. PMID: 12166301 Review.
Cited by
-
Habitat-based constraints on food web structure and parasite life cycles.Oecologia. 2014 Apr;174(4):1311-21. doi: 10.1007/s00442-013-2835-0. Epub 2013 Nov 19. Oecologia. 2014. PMID: 24249118
-
Biogeography of the theileriosis vector, Rhipicephalus appendiculatus under current and future climate scenarios of Zimbabwe.Exp Appl Acarol. 2023 Jun;90(1-2):67-82. doi: 10.1007/s10493-023-00796-1. Epub 2023 May 12. Exp Appl Acarol. 2023. PMID: 37171505 Free PMC article.
-
Large-scale health disparities associated with Lyme disease and human monocytic ehrlichiosis in the United States, 2007-2013.PLoS One. 2018 Sep 27;13(9):e0204609. doi: 10.1371/journal.pone.0204609. eCollection 2018. PLoS One. 2018. PMID: 30261027 Free PMC article.
-
Local impact of temperature and precipitation on West Nile virus infection in Culex species mosquitoes in northeast Illinois, USA.Parasit Vectors. 2010 Mar 19;3(1):19. doi: 10.1186/1756-3305-3-19. Parasit Vectors. 2010. PMID: 20302617 Free PMC article.
-
A pilot study to delimit tsetse target populations in Zimbabwe.PLoS Negl Trop Dis. 2017 May 3;11(5):e0005566. doi: 10.1371/journal.pntd.0005566. eCollection 2017 May. PLoS Negl Trop Dis. 2017. PMID: 28467409 Free PMC article.
References
-
- Srivastava A, Nagpal B, Saxena R, Subbarao S. Predictive habitat modeling for forest malaria vector species An. dirus in India – a GIS-based approach. Current Science. 2001;80:1129–1134.
Publication types
MeSH terms
LinkOut - more resources
Full Text Sources
Medical
