. 2008 May 1;314(8):1860-8.
doi: 10.1016/j.yexcr.2008.02.008. Epub 2008 Feb 29.

Suppression of sphingomyelin synthase 1 by small interference RNA is associated with enhanced ceramide production and apoptosis after photodamage

Affiliations

Suppression of sphingomyelin synthase 1 by small interference RNA is associated with enhanced ceramide production and apoptosis after photodamage

Duska Separovic et al. Exp Cell Res. .

Abstract

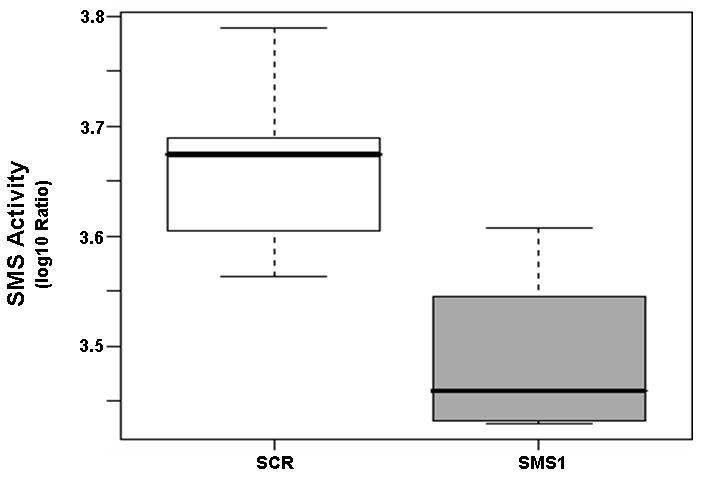
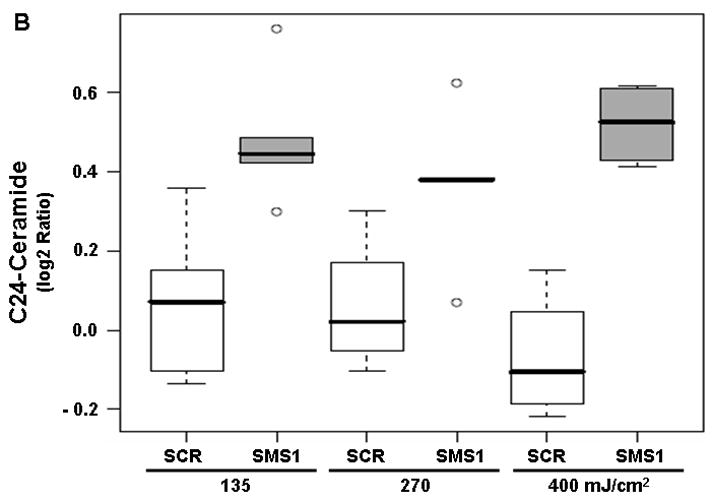
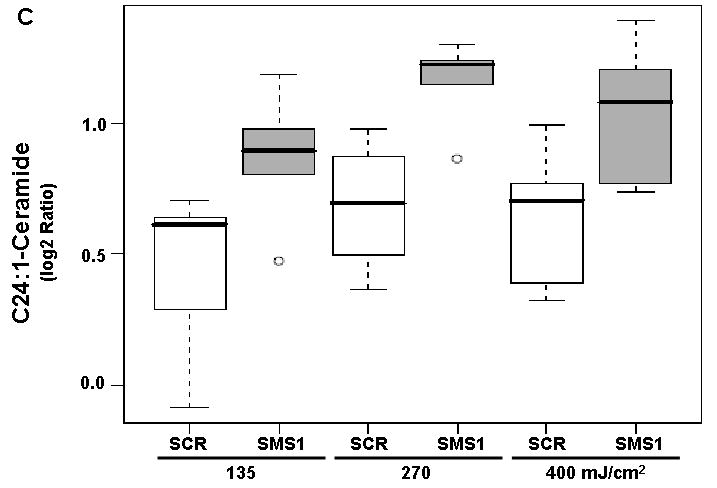
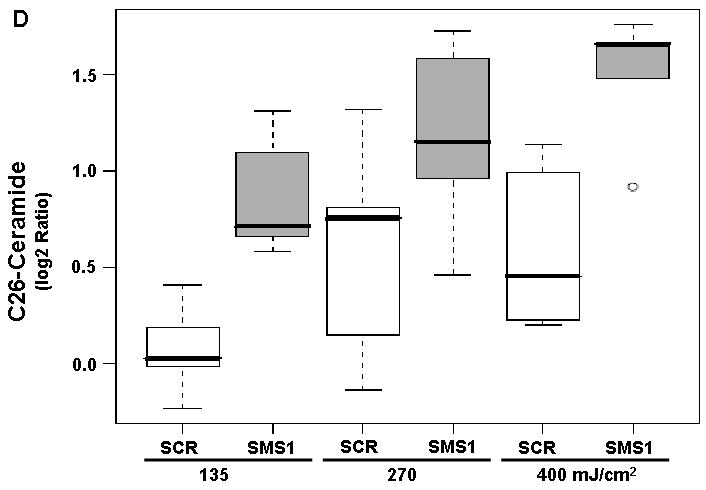
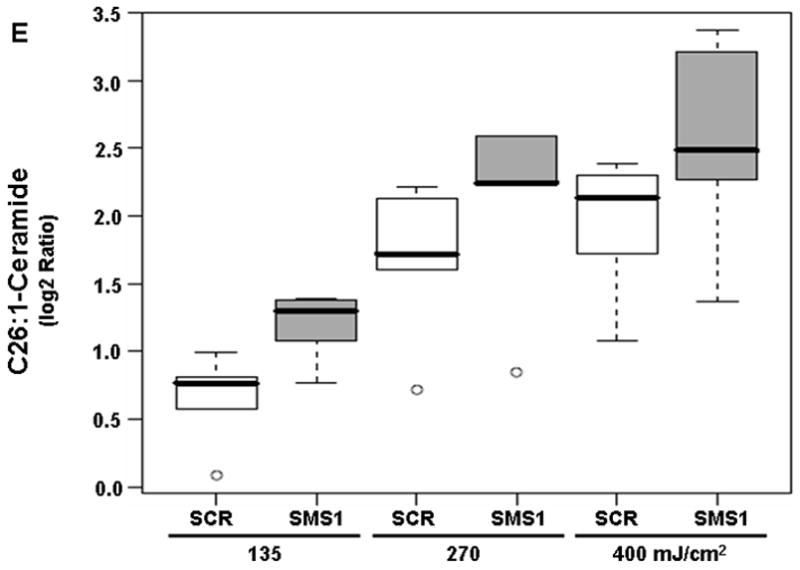
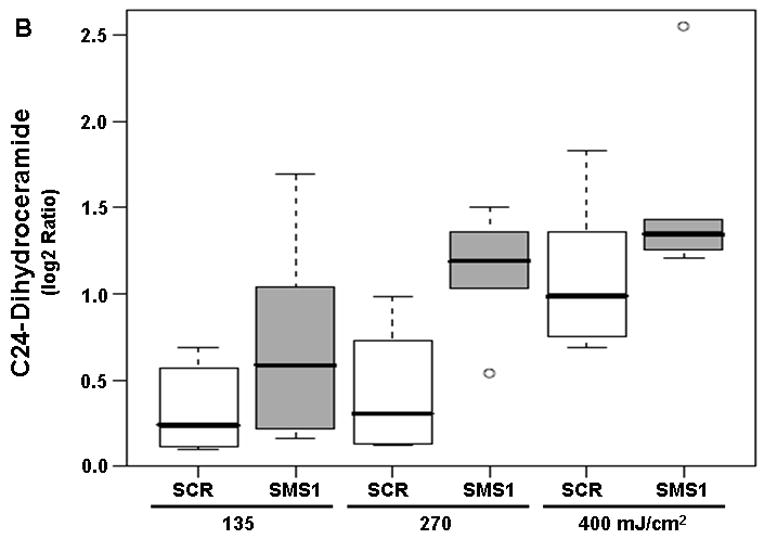
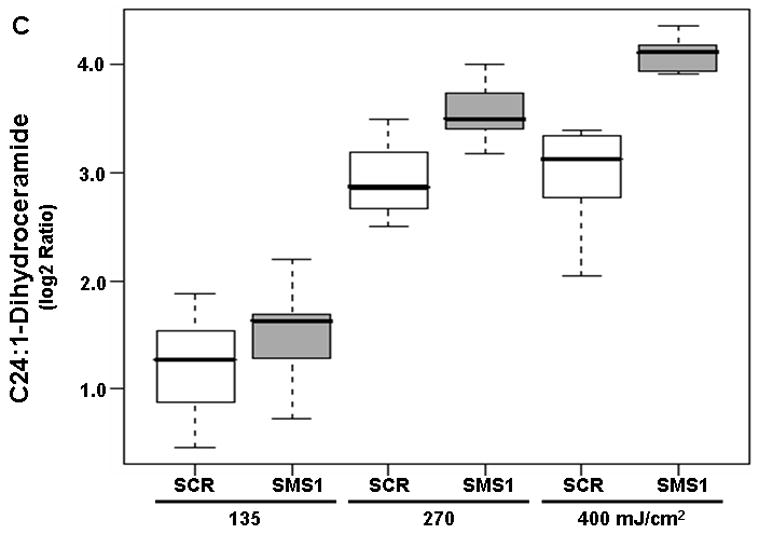
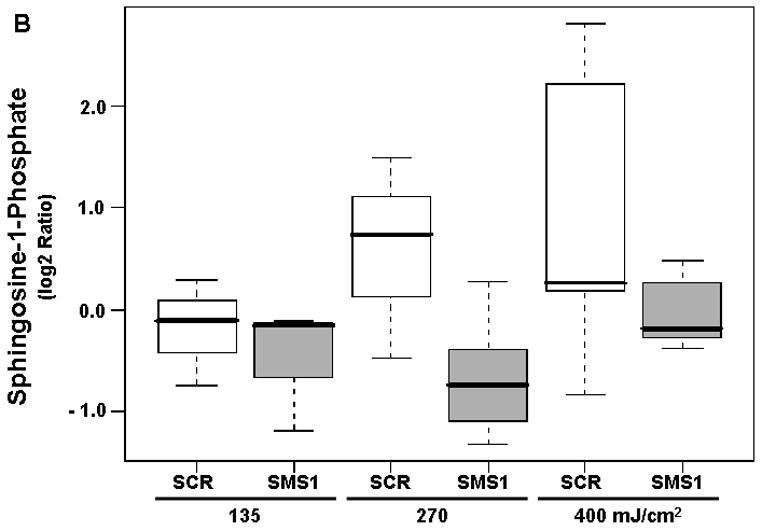
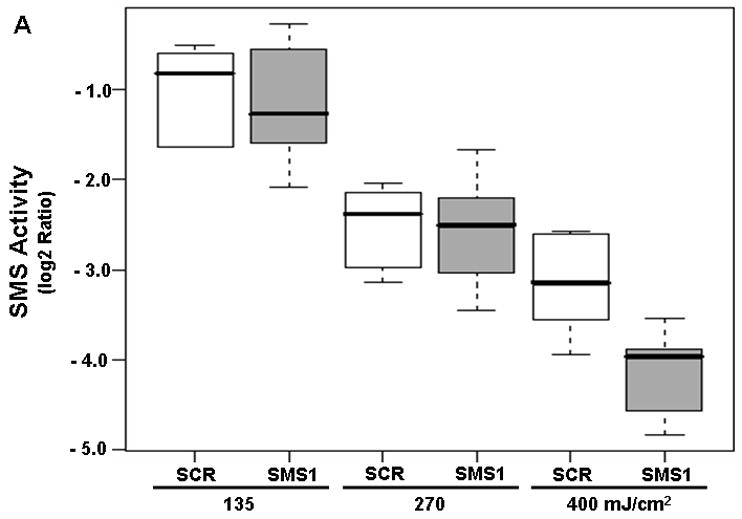
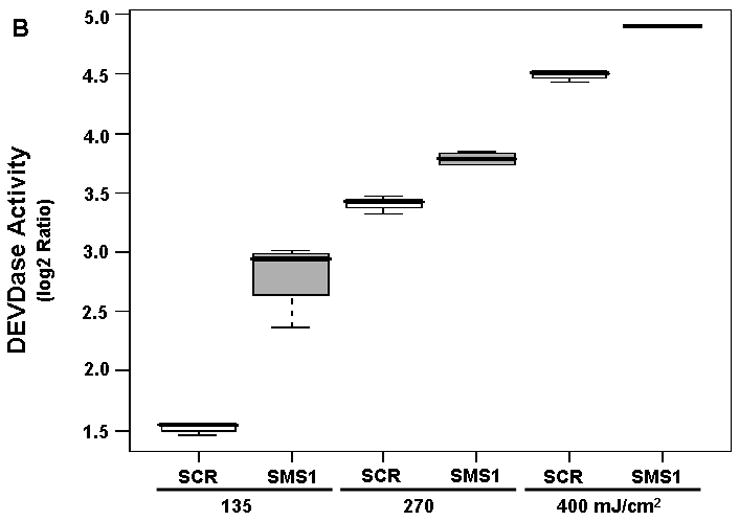
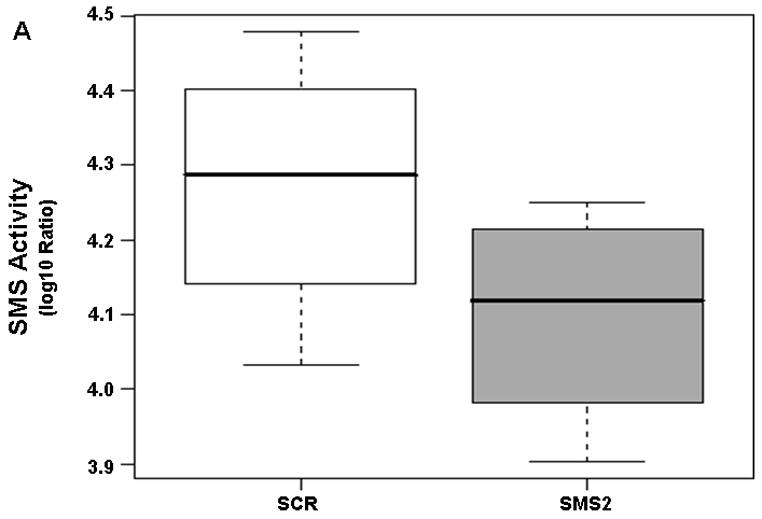
We have shown that overexpression of SMS1, an enzyme that converts de novo ceramide into sphingomyelin, is accompanied by attenuated ceramide response and apoptotic resistance after photodamage with the photosensitizer Pc 4 (photodynamic therapy; PDT). To test whether SMS1 overexpression-related effects after PDT can be reversed, in this study SMS1 was downregulated in Jurkat T lymphoma/leukemia cells using small inhibitory RNA (siRNA) for SMS1. Compared to scrambled (control) siRNA-transfectants, in SMS1 siRNA-transfected cells the activity of SMS at rest was downregulated with concomitant decrease in sphingomyelin mass. In SMS1 siRNA-transfected cells increases in ceramides were higher than in control siRNA-transfectants after PDT. Similar findings were obtained for dihydroceramides suggesting the involvement of de novo ceramide pathway. PDT-induced DEVDase (caspase-3-like) activation was enhanced in SMS1 siRNA-transfected cells compared to their control counterparts. The data show that RNA interference-dependent downregulation of SMS1 is associated with increased accumulation of ceramide and dihydroceramide with concomitant sensitization of cells to apoptosis after photodamage. Similarly, in SMS2 siRNA-transfected cells, downregulation of SMS activity was accompanied by potentiated DEVDase activation post-photodamage. These findings suggest that SMS is a potential novel molecular target that can augment therapeutic efficacy of PDT.


Figures

Figure 1
Figure 1
Sphingomyelin synthase (SMS) is downregulated in SMS1 siRNA-transfected Jurkat cells. Cells were transfected with SMS1- or scrambled siRNA as described in “Material and Methods”. Two days after transfection, cells were collected and seeded in fresh growth medium with or without Pc 4 (200 nM). Following overnight exposure to Pc 4, cells were harvested, and the enzyme activity was determined in cell lysates as described in “Material and Methods”. There was no significant difference between Pc 4- and untreated-controls in either cell type, and for the analysis, the values of the two controls were grouped. SCR, scrambled siRNA-transfectants; SMS1, SMS1 siRNA -transfectants.
Figure 2
Figure 2
Mass spectrometric analysis reveals enhanced ceramide response to PDT in SMS1 siRNA-transfected Jurkat cells. (A) C22-ceramide; (B) C24-ceramide; (C) C24:1-ceramide; (D) C26-ceramide; (E) C26:1-ceramide. Cells were transfected with SMS1- or scrambled-siRNA as described in “Materials and Methods”. Two days after transfection, cells were collected and seeded in fresh growth medium with or without Pc 4 (200 nM). Following overnight exposure to Pc 4, cells were irradiated with red light at the indicated light fluences (mJ/cm2). Two hours post-PDT cells were harvested, and lipids were extracted. Ceramide levels were determined by mass spectrometry (see “Materials and Methods”). Three-six independent measurements of ceramides were performed. The Y-axis shows log2 ratios for each ceramide as a function of both group and dose variable. This and subsequent figures: the boxes contain 50% of the data and the median value is shown as the horizontal thick line within the box. The whiskers extend to the most extreme data point (minimum and maximum value) which is no more than 1.5 times the interquartile range (i.e., remaining 50% of the data) from the box. Outliers are shown as empty circles. SCR, scrambled siRNA-transfectants; SMS1, SMS1 siRNA -transfectants.
Figure 2
Figure 2
Mass spectrometric analysis reveals enhanced ceramide response to PDT in SMS1 siRNA-transfected Jurkat cells. (A) C22-ceramide; (B) C24-ceramide; (C) C24:1-ceramide; (D) C26-ceramide; (E) C26:1-ceramide. Cells were transfected with SMS1- or scrambled-siRNA as described in “Materials and Methods”. Two days after transfection, cells were collected and seeded in fresh growth medium with or without Pc 4 (200 nM). Following overnight exposure to Pc 4, cells were irradiated with red light at the indicated light fluences (mJ/cm2). Two hours post-PDT cells were harvested, and lipids were extracted. Ceramide levels were determined by mass spectrometry (see “Materials and Methods”). Three-six independent measurements of ceramides were performed. The Y-axis shows log2 ratios for each ceramide as a function of both group and dose variable. This and subsequent figures: the boxes contain 50% of the data and the median value is shown as the horizontal thick line within the box. The whiskers extend to the most extreme data point (minimum and maximum value) which is no more than 1.5 times the interquartile range (i.e., remaining 50% of the data) from the box. Outliers are shown as empty circles. SCR, scrambled siRNA-transfectants; SMS1, SMS1 siRNA -transfectants.
Figure 3
Figure 3
Mass spectrometric analysis reveals enhanced dihydroceramide response to PDT in siRNA SMS1-transfected Jurkat cells. (A) C22-dihydroceramide; (B) C24-dihydroceramide; (C) C24:1-dihydroceramide. See Fig. 2 for experimental details. Dihydroceramide levels were determined by mass spectrometry (see “Materials and Methods”). Three-six independent measurements of ceramides were performed. The Y-axis shows log2 ratios for each ceramide as a function of both group and dose variable. Outliers are shown as empty circles. SCR, scrambled siRNA-transfectants; SMS1, SMS1 siRNA -transfectants.
Figure 3
Figure 3
Mass spectrometric analysis reveals enhanced dihydroceramide response to PDT in siRNA SMS1-transfected Jurkat cells. (A) C22-dihydroceramide; (B) C24-dihydroceramide; (C) C24:1-dihydroceramide. See Fig. 2 for experimental details. Dihydroceramide levels were determined by mass spectrometry (see “Materials and Methods”). Three-six independent measurements of ceramides were performed. The Y-axis shows log2 ratios for each ceramide as a function of both group and dose variable. Outliers are shown as empty circles. SCR, scrambled siRNA-transfectants; SMS1, SMS1 siRNA -transfectants.
Figure 4
Figure 4
Mass spectrometric analysis identifies different responses of sphingosine (A) and sphingosine-1-phosphate (B) to PDT in SMS1 siRNA-transfected Jurkat cells compared to their control counterparts. See Fig. 2 for experimental details. Sphingolipid levels were determined by mass spectrometry (see “Materials and Methods”). Three-six independent measurements of sphingolipids were performed. The Y-axis shows log2 ratios for each sphingolipid as a function of both group and dose variable. Outliers are shown as empty circles. SCR, scrambled siRNA-transfectants; SMS1, SMS1 siRNA -transfectants.
Figure 4
Figure 4
Mass spectrometric analysis identifies different responses of sphingosine (A) and sphingosine-1-phosphate (B) to PDT in SMS1 siRNA-transfected Jurkat cells compared to their control counterparts. See Fig. 2 for experimental details. Sphingolipid levels were determined by mass spectrometry (see “Materials and Methods”). Three-six independent measurements of sphingolipids were performed. The Y-axis shows log2 ratios for each sphingolipid as a function of both group and dose variable. Outliers are shown as empty circles. SCR, scrambled siRNA-transfectants; SMS1, SMS1 siRNA -transfectants.
Figure 5
Figure 5
The effects of PDT on the activities of SMS (A) and DEVDase (B) in scrambled siRNA- and SMS1 siRNA-transfected Jurkat cells. Forty eight hours after transfection, cells were treated overnight with Pc 4 (200 nM), irradiated at the indicated light fluences, and incubated for 2 h. After the cells were harvested, (A) cell lysates were prepared and the activity of SMS was assayed using C6-NBD-ceramide as the substrate; (B) DEVDase activity was measured in cell lysates spectrofluorimetrically using DEVD-AMC as the substrate. Three-five independent determinations of the enzymes were performed. The Y-axis shows log2 ratios for each enzyme as a function of both group and dose variable. SCR, scrambled siRNA-transfectants; SMS1, SMS1 siRNA -transfectants.
Figure 5
Figure 5
The effects of PDT on the activities of SMS (A) and DEVDase (B) in scrambled siRNA- and SMS1 siRNA-transfected Jurkat cells. Forty eight hours after transfection, cells were treated overnight with Pc 4 (200 nM), irradiated at the indicated light fluences, and incubated for 2 h. After the cells were harvested, (A) cell lysates were prepared and the activity of SMS was assayed using C6-NBD-ceramide as the substrate; (B) DEVDase activity was measured in cell lysates spectrofluorimetrically using DEVD-AMC as the substrate. Three-five independent determinations of the enzymes were performed. The Y-axis shows log2 ratios for each enzyme as a function of both group and dose variable. SCR, scrambled siRNA-transfectants; SMS1, SMS1 siRNA -transfectants.
Figure 6
Figure 6
(A) SMS is downregulated in SMS2 siRNA-transfectants. Cells were transfected with SMS2- or scrambled siRNA as described in “Material and Methods”. Two days after transfection, cells were collected and seeded in fresh growth medium with or without Pc 4 (200 nM). Following overnight exposure to Pc 4, cells were harvested, and the enzyme activity was determined in cell lysates as described in “Material and Methods”. (B) PDT-triggered activation of DEVDase is promoted in SMS2 siRNA-transfected Jurkat cells. Forty-eight hours after transfection, the cells were treated overnight with Pc 4 (200 nM), irradiated at the indicated light fluences and then incubated for 2 h. After the cells were harvested, DEVDase activity was measured in cell lysates spectrofluorimetrically using DEVD-AMC as the substrate. Three-five independent determinations of the enzyme were performed. The Y-axis shows log2 ratios for the enzyme as a function of both group and dose variable. SCR, scrambled siRNA-transfectants; SMS2, SMS2 siRNA -transfectants.
Figure 6
Figure 6
(A) SMS is downregulated in SMS2 siRNA-transfectants. Cells were transfected with SMS2- or scrambled siRNA as described in “Material and Methods”. Two days after transfection, cells were collected and seeded in fresh growth medium with or without Pc 4 (200 nM). Following overnight exposure to Pc 4, cells were harvested, and the enzyme activity was determined in cell lysates as described in “Material and Methods”. (B) PDT-triggered activation of DEVDase is promoted in SMS2 siRNA-transfected Jurkat cells. Forty-eight hours after transfection, the cells were treated overnight with Pc 4 (200 nM), irradiated at the indicated light fluences and then incubated for 2 h. After the cells were harvested, DEVDase activity was measured in cell lysates spectrofluorimetrically using DEVD-AMC as the substrate. Three-five independent determinations of the enzyme were performed. The Y-axis shows log2 ratios for the enzyme as a function of both group and dose variable. SCR, scrambled siRNA-transfectants; SMS2, SMS2 siRNA -transfectants.

Similar articles

Cited by

References

    1. Hannun YA, Luberto C, Argraves KM. Enzymes of sphingolipid metabolism: from modular to integrative signaling. Biochemistry. 2001;40:4893–4903. - PubMed
    1. Hanada K. Serine palmitoyltransferase, a key enzyme of sphingolipid metabolism. Biochim Biophys Acta. 2003;1632:16–30. - PubMed
    1. Kester M, Kolesnick R. Sphingolipids as therapeutics. Pharmacol Res. 2003;47:365–371. - PubMed
    1. Zheng W, Kollmeyer J, Symolon H, Momin A, Munter E, Wang E, Kelly S, Allegood JC, Liu Y, Peng Q, Ramaraju H, Sullards MC, Cabot M, Merrill AH., Jr Ceramides and other bioactive sphingolipid backbones in health and disease: lipidomic analysis, metabolism and roles in membrane structure, dynamics, signaling and autophagy. Biochim Biophys Acta. 2006;1758:1864–1884. - PubMed
    1. Huitema K, Van Den Dikkenberg J, Brouwers JF, Holthuis JC. Identification of a family of animal sphingomyelin synthases. Embo J. 2004;23:33–44. - PMC - PubMed

Publication types

MeSH terms