. 2008 Dec;18(12):2796-810.
doi: 10.1093/cercor/bhn038. Epub 2008 Mar 28.

Cortical dynamics subserving visual apparent motion

Affiliations

Cortical dynamics subserving visual apparent motion

Bashir Ahmed et al. Cereb Cortex. 2008 Dec.

Abstract

Motion can be perceived when static images are successively presented with a spatial shift. This type of motion is an illusion and is termed apparent motion (AM). Here we show, with a voltage sensitive dye applied to the visual cortex of the ferret, that presentation of a sequence of stationary, short duration, stimuli which are perceived to produce AM are, initially, mapped in areas 17 and 18 as separate stationary representations. But time locked to the offset of the 1st stimulus, a sequence of signals are elicited. First, an activation traverses cortical areas 19 and 21 in the direction of AM. Simultaneously, a motion dependent feedback signal from these areas activates neurons between areas 19/21 and areas 17/18. Finally, an activation is recorded, traveling always from the representation of the 1st to the representation of the next or succeeding stimuli. This activation elicits spikes from neurons situated between these stimulus representations in areas 17/18. This sequence forms a physiological mechanism of motion computation which could bind populations of neurons in the visual areas to interpret motion out of stationary stimuli.


Figures
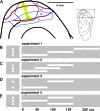
Figure 1.
Figure 1.
Experimental setup. (A) The insert shows the orientation of ferret brain. The visual cortex is enlarged at the left. The hexagonal photodiode array monitor visual areas 17, 18, 19, and 21. Each channel of the array picks up the signal from a cortical area with a diameter of approximately 150 μm. The representations of the vertical meridians of the field of view are red, the horizontal meridian is green and the representation of the 5° center of field of view, yellow (after Manger et al. 2002). In all experiments 2 × 2° white squares were presented for 83 ms along the vertical meridian. The baseline condition was a homogenous gray background of the same average luminance as the stimulus conditions. (B) Experiment 1, 1 square appears 1st 3.5° below, then at 83 ms at the center of field of view, and at 166 ms 3.5° above the horizontal meridian. Control stimuli: a single stationary square displayed in 1 of these 3 positions. (C) Experiment 2: As in (B) but the onset times are 0, 42, and 83 ms. (D) Experiment 3: onset times 0 and 83 ms, distance 7° between 1st and last square. (E) Experiment 4: split motion, central square presented at 0 ms, at 83 ms 1 square in top + 3.5° and 1 in lower position −3.5° from the central square. Controls (not shown) at 0 ms single square in central position, at 83 ms the top and lower square simultaneously.
Figure 2.
Figure 2.
Statistics of the ΔV(t)xy. The voltage sensitive dye signal from 1 channel, ΔV(t)xy, after 12 averages (Animal 89). The lower threshold is the 0.01 threshold uncorrected for multiple comparisons. The upper threshold labeled 0.01 BF is the Bonferroni corrected threshold.
Figure 3.
Figure 3.
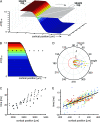
Statistical estimation of the progress of the wave-fronts. (A) A schematic of the depolarization wave-front progressing from the cortical retinotopic site of one square to the retinotopic site of the next square. During its passage between these sites, the wave-front passes cortical positions monitored by the photodiode detector array channels, symbolized by the plane with the small squares. For the time interval of the sliding time window, the mean values of the ΔV(t)rel were calculated across the width of the wave-front. This mean level is indicated on the wave-front as the transition of the dark blue to the slightly lighter blue color. Then the amplitude from ΔV(t)rel mean to the maximum value 1.0 was divided into 10 levels of amplitudes. This allowed visualization of the wave-front as it passed over a given cortical point on its path by exhibiting successively higher levels of amplitudes. These 10 levels of the wave-front are illustrated by the 10 different colors deviating from the dark blue. (B) One section of the wave-front at a given time point. If the wave-front progresses in 1 direction, 1 amplitude level of the wave-front will pass successive points of the cortex with increasing time. The same applies for any other amplitude level represented by a different color. Note that wave-fronts, in contrasts to traveling waves do not need to progress with constant velocity and amplitude. (C) Plot of real data from animal 60, showing the progression of the yellow amplitude level in (B) across the cortex from the retinotopic site of the lower square to the retinotopic site of the central square. Time zero indicates 100 ms after the start of the lower square stimulus. (D) Polar plot of the direction and significance of the wave-front progression for all amplitude levels. The color coding of the amplitude levels is seen in (B). The rings 2,4.6 show the −log10P values of the slope of the regression of each amplitude level being equal to zero. The polar plot also shows that the most significant direction of progress is 0°. (E) Regressions of position versus time for all 10 amplitude levels for the optimal direction of progress aligned by their centers of gravity. This regression has R2 = 0.85 and a −log10P > 7. The P values of the regressions for each animal are shown in Table 2. The slope of the regression of the aligned points will underestimate the velocity with which the wave-front progresses (see Fig. 6).
Figure 4.
Figure 4.
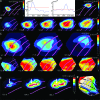
The dynamics of AM in Experiment 1 (see Fig. 1b for stimulus presentation; Animal 60). (A) Control trials for experiment 1. The absolute depolarization ΔV(t) in response to a single square at the time when the ΔV(t) is maximum. Panel shows 3 different trials. From the left: square in position 3.5° below the horizontal meridian, square in central position, square 3.5° above horizontal meridian. In the control trials, the times of stimulus presentation of the single squares at these 3 positions were identical to those in the AM trials (lower square presented at 0 ms, central square presented in isolation at 83 ms, and top square presented in isolation at 166 ms). The time after start of 1st stimulus is shown as well as cytoarchitectural areal borders. (B) AM, ΔV(t) as a function of time after the start of the 1st square stimulus. Note the distinct representations of the square as in (A) and also the earlier time for the maximal depolarization compared with (A). (C) AM, only the strongly depolarized parts of cortex are shown corresponding to the retinotopic position of the square stimulus. (D) AM, the dynamics of the motion feedback depolarization from areas 19/21 to area 17. Time derivative of difference between ΔV(t)rel AM and sum of ΔV(t)rel from 3 single square presentations (control). Note motion feedback depolarization at 117–120 ms and the subsequent start of the moving depolarization wave-fronts at 17/18 from 126 ms, and the motion of the position of the square in area 19/21, 117–136 ms. In (C) and (D), the data have been filtered in time with a 20 ms Gaussian filter.
Figure 5.
Figure 5.
Motion feedback and the 17/18 wave-front. Snapshots of the ΔV(t) at the times after the onset of the lower square in experiment 1. Note the simultaneous progress of the 19/21 wave-front at the motion feedback at 116–124 ms and the full progression of the (overshooting) wave-front just below the 17/18 area border. At 206–213 ms, the feedback repeats, albeit this time with minimal progress of the 19/21 wave-front (Animal 98). That the motion feedback indeed has direction toward the area 17/18 border is shown in Figure 6C.
Figure 6.
Figure 6.
Examples of the wave-fronts and motion feedback during AM. The examples show the regression on the point clouds obtained from each point of the cortex along the paths taken by the wave-fronts in the direction found by the wave-front algorithm (Fig. 3). (A) The 1st motion of the 17/18 wave-front, in experiment 1, 31–40 ms after the offset of the lower square. The abscissa shows the distance form the retinotopic site of the lower square. The ordinate shows the time in ms centered as in Figure 3. The arrow shows the direction found by the algorithm (data d(ΔV(t))/dt; Animal 60). Estimated mean velocity 0.21 mm/ms. (B) The motion of the 19/21 wave-front 31–43 ms after the offset of the central square (data d(ΔV(t))/dt; Animal 98). Abscissa distance from center square retinotopic site. (C) motion feedback in the time interval 22–62 ms after the offset of the lower square in experiment 1 (data: ΔV(t); Animal 98). Abscissa: distance from the retinotopic site in area 19/21. (D) Motion feedback in experiment 3, 31–56 ms after offset of lower square (data: ΔV(t); Animal 116). Abscissa: distance from the retinotopic site in area 19/21.
Figure 7.
Figure 7.
Experiments 2, 3, and 4. (A) Experiment 3 (Fig. 1C; Animal 106), time derivatives of ΔV(t) to the appearance of the 2 squares. Note the temporal and spatial separation at the retinotopic sites of the squares at the times for the maximal d(ΔV(t))/dt. Onset of lower square was at 0 ms and of top square at 83 ms. (B) Same experiment as in (A), same animal; ΔV(t) shows a smooth motion of the maximum of the wave-front after starting at 116 ms (between the 102.5 ms and the 124 ms) and continuing up to 230 ms. (C) Experiment 2, d(ΔV(t))/dt, shown at 47.1 ms after the onset of the lower square, at 71.8 ms (30.3 ms after the onset of the central square, and at 120.9 ms (37.9 ms after the onset of the top square; Animal 106). (D) Experiment 2, same animal as in (C). ΔV(t)rel, showing the phase relations over the 4 cortical areas. Note the start of the wave-fronts propagation between 112.9 ms and 124 ms and again at 152.8 ms (29 ms after the offset of the central square). (E) Experiment 4, split motion, (see Fig. 1E; Animal 101), note the split of depolarization. (F) Proposed mechanism of AM. Cartoon illustrating the time order of changes in the membrane potentials of the neurons in the supragranular layers of areas 21,19,18, and 17 at the time interval of the AM wave-fronts. The wave-front in 19/21 traverses to the next retinotopic site. Simultaneously the neurons in 19/21 send a motion feedback toward the corresponding retinotopic site at the 17/18 border. The motion feedback may also depolarize the space between these borders as the iso-elevation domains of the retinotopic map in the ferret are in the direction of the motion feedback (Manger et al. 2002). Arriving at the retinotopic site and depolarizing the neurons at 17/18, these neurons start the 17/18 wave-front which then would lag the 19/21 wave-front. This cartoon could explain the dynamics as seen in (D).
Figure 8.
Figure 8.
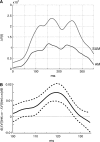
Comparison of the ΔV(t) of AM with the ΔV(t) of the sum of the individual presentations. (A) The mean signal ΔV(t) for all channels covering areas 17 and 18. Experiment 1. Gray curve: ΔV(t)sum, that is, the arithmetical sum of the signals to the lower square, the center square and the top square when presented singly. Dark curve: AM condition. Note the stronger and longer lasting signal ΔV(t)sum and the earlier appearance of the peak depolarizations in AM (Animal 60). (B) Comparison of the ΔV(t)rel of AM with the ΔV(t)rel of the sum of the individual presentations. The time relation of the motion feedback depolarization, from areas 19/21 toward the area 17/18 border. The time derivative from the path of the feedback depolarization of the difference in signal between AM and the sum of the signals to stationary squares, that is, d(ΔV(t)rel,AM − ΔV(t)rel,sum)/dt is on the ordinate. Abscissa: time after start of 1st stimulus in the AM condition. The curve shows the mean d(ΔV(t)rel,AM − ΔV(t)rel,sum)/dt for all animals, The stippled lines show the standard errors.
Figure 9.
Figure 9.
Responses from neurons within retinotopic sites and between retinotopic sites. (A) Layer III multiunit recorded at the border between areas 17/18. Top: on-response (blue) at 115 ms, 32 ms after stimulus onset to the presentation of the single square at center position. Bottom: responses during AM, onset at 115 ms. The 80% of maximal firing rate is shown in green. Note no differences in onset latency, but on-response decays faster. Experiment 1 (Animal 62). (B) Multiunit, layer II area 18, between lower and center square retinotopic site. Top: Response to the presentation of the single center square (not significant). Bottom; significantly correlated responses from the same multiunit during the passage of the moving depolarization wave-fronts at 116–144 ms, Experiment 4 (Animal 106). (C) Left: Histogram of responsive units at retinotopic sites according to cortical layer. Right: idem for units located between retinotopic sites. Blue: significantly and positively correlated to average ΔV(t) at time of passage of moving depolarization wave-fronts; red: significantly and negatively correlated; green: not significantly correlated. (D) Top: mean difference in firing rate of between site units in AM versus sum of single responses. Bottom: These units fired statistically significantly more spikes in the interval 120–145 ms during AM as compared with the firing in the single square conditions (P < 0.01, n = 37).
Figure 10.
Figure 10.
Time relation between the relative drive and the firing of the neurons in between the retinotopic sites at the area 17/18 border at the time interval of the passage of the wave-front. The d(ΔV(t))/dt is the relative input driving force (see text). For all electrode penetration sites the maximum value in the interval 100–140 ms of the d(ΔV(t))/dt of the corresponding supragranular cortex was normalized to 1.0. A similar normalization was done for the instantaneous firing rate r(t). Thereafter the individual files were summed and divided by the number of penetration sites for d(ΔV(t))/dt, and divided by the number of multiunits (n = 37) for r(t) to give the values shown on the ordinate. The abcissa is the time from the start of the preceding stimulus. This result is consistent with the idea that the moving wave-front ΔV(t) increase drives the neurons to fire in between the retinotopic sites of the square stimuli.

Similar articles

Cited by

References

    1. Anderson JC, Martin KAC. Connection from cortical area V2 to MT in macaque monkey. J Comp Neurol. 2002;443:56–70. - PubMed
    1. Anstis SM, Mather G. Effects of luminance and contrast on direction of ambiguous apparent motion. Perception. 1985;14:167–179. - PubMed
    1. Albright TD, Stoner GR. Visual motion perception. Proc Natl Acad Sci USA. 1995;92:2433–2440. - PMC - PubMed
    1. Barlow HB, Levick WR. The mechanism of directionally selective units in the rabbit's retina. J Physiol. 1965;193:327–342. - PMC - PubMed
    1. Bergles DE, Jahr CE. Synaptic activation of glutamate transporters in hippocampal astrocytes. Neuron. 1997;19:1297–1308. - PubMed

Publication types