

Autophosphorylation and dephosphorylation by soluble forms of the nitrate-responsive sensors NarX and NarQ from Escherichia coli K-12
- PMID: 18375557
- PMCID: PMC2395026
- DOI: 10.1128/JB.00092-08
Autophosphorylation and dephosphorylation by soluble forms of the nitrate-responsive sensors NarX and NarQ from Escherichia coli K-12
Abstract
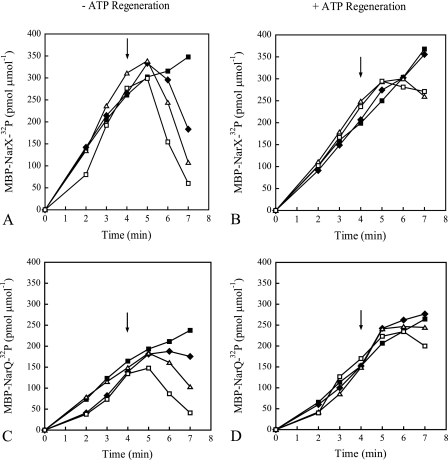
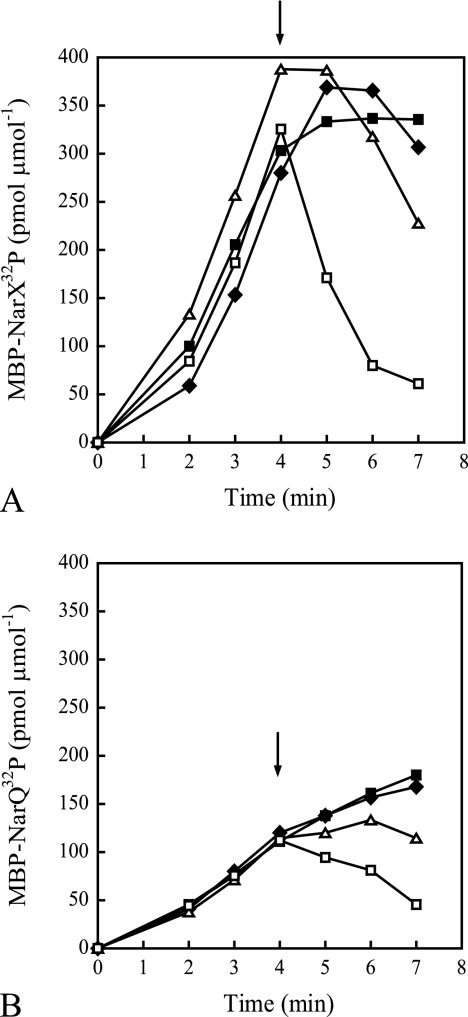
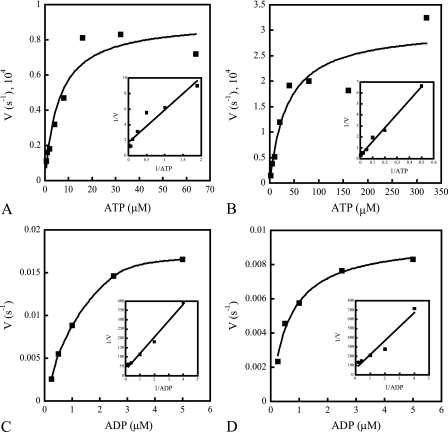
NarX-NarL and NarQ-NarP are paralogous two-component regulatory systems that control Escherichia coli gene expression in response to the respiratory oxidants nitrate and nitrite. Nitrate stimulates the autophosphorylation rates of the NarX and NarQ sensors, which then phosphorylate the response regulators NarL and NarP to activate and repress target operon transcription. Here, we investigated both the autophosphorylation and dephosphorylation of soluble sensors in which the maltose binding protein (MBP) has replaced the amino-terminal transmembrane sensory domain. The apparent affinities (K(m)) for ADP were similar for both proteins, about 2 microM, whereas the affinity of MBP-NarQ for ATP was lower, about 23 microM. At a saturating concentration of ATP, the rate constant of MBP-NarX autophosphorylation (about 0.5 x 10(-4) s(-1)) was lower than that observed for MBP-NarQ (about 2.2 x 10(-4) s(-1)). At a saturating concentration of ADP, the rate constant of dephosphorylation was higher than that of autophosphorylation, about 0.03 s(-1) for MBP-NarX and about 0.01 s(-1) for MBP-NarQ. For other studied sensors, the published affinities for ADP range from about 16 microM (KinA) to about 40 microM (NtrB). This suggests that only a small proportion of NarX and NarQ remain phosphorylated in the absence of nitrate, resulting in efficient response regulator dephosphorylation by the remaining unphosphorylated sensors.
Figures
Similar articles
-
Asymmetric cross-regulation between the nitrate-responsive NarX-NarL and NarQ-NarP two-component regulatory systems from Escherichia coli K-12.Mol Microbiol. 2010 Jan;75(2):394-412. doi: 10.1111/j.1365-2958.2009.06987.x. Epub 2009 Dec 4. Mol Microbiol. 2010. PMID: 19968795 Free PMC article.
-
Phosphorylation and dephosphorylation of the NarQ, NarX, and NarL proteins of the nitrate-dependent two-component regulatory system of Escherichia coli.J Bacteriol. 1994 Aug;176(16):4985-92. doi: 10.1128/jb.176.16.4985-4992.1994. J Bacteriol. 1994. PMID: 8051011 Free PMC article.
-
Dual response regulators (NarL and NarP) interact with dual sensors (NarX and NarQ) to control nitrate- and nitrite-regulated gene expression in Escherichia coli K-12.J Bacteriol. 1993 Jun;175(11):3259-68. doi: 10.1128/jb.175.11.3259-3268.1993. J Bacteriol. 1993. PMID: 8501030 Free PMC article.
-
Nitrate regulation of anaerobic respiratory gene expression in Escherichia coli.Mol Microbiol. 1993 Aug;9(3):425-34. doi: 10.1111/j.1365-2958.1993.tb01704.x. Mol Microbiol. 1993. PMID: 8412692 Review.
-
Alternative respiratory pathways of Escherichia coli: energetics and transcriptional regulation in response to electron acceptors.Biochim Biophys Acta. 1997 Jul 4;1320(3):217-34. doi: 10.1016/s0005-2728(97)00034-0. Biochim Biophys Acta. 1997. PMID: 9230919 Review.
Cited by
-
Kinetic characterization of the WalRKSpn (VicRK) two-component system of Streptococcus pneumoniae: dependence of WalKSpn (VicK) phosphatase activity on its PAS domain.J Bacteriol. 2010 May;192(9):2346-58. doi: 10.1128/JB.01690-09. Epub 2010 Feb 26. J Bacteriol. 2010. PMID: 20190050 Free PMC article.
-
Asymmetric cross-regulation between the nitrate-responsive NarX-NarL and NarQ-NarP two-component regulatory systems from Escherichia coli K-12.Mol Microbiol. 2010 Jan;75(2):394-412. doi: 10.1111/j.1365-2958.2009.06987.x. Epub 2009 Dec 4. Mol Microbiol. 2010. PMID: 19968795 Free PMC article.
-
Fundamental constraints on the abundances of chemotaxis proteins.Biophys J. 2015 Mar 10;108(5):1293-305. doi: 10.1016/j.bpj.2015.01.024. Biophys J. 2015. PMID: 25762341 Free PMC article.
-
Conserved mechanism for sensor phosphatase control of two-component signaling revealed in the nitrate sensor NarX.Proc Natl Acad Sci U S A. 2010 Dec 7;107(49):21140-5. doi: 10.1073/pnas.1013081107. Epub 2010 Nov 15. Proc Natl Acad Sci U S A. 2010. PMID: 21078995 Free PMC article.
-
CrdS and CrdA comprise a two-component system that is cooperatively regulated by the Che3 chemosensory system in Myxococcus xanthus.mBio. 2011 Aug 2;2(4):e00110-11. doi: 10.1128/mBio.00110-11. Print 2011. mBio. 2011. PMID: 21810965 Free PMC article.
References
-
- Bilwes, A. M., C. M. Quezada, L. R. Croal, B. R. Crane, and M. I. Simon. 2001. Nucleotide binding by the histidine kinase CheA. Nat. Struct. Biol. 8353-360. - PubMed
-
- Bradford, M. M. 1976. A rapid and sensitive method for the quantitation of microgram quantities of protein utilizing the principle of protein-dye binding. Anal. Biochem. 72248-254. - PubMed
Publication types
MeSH terms
Substances
Grants and funding
LinkOut - more resources
Full Text Sources
Molecular Biology Databases
Miscellaneous
