. 2008 May;147(1):263-79.
doi: 10.1104/pp.108.118059. Epub 2008 Mar 28.

Disruption of the Arabidopsis circadian clock is responsible for extensive variation in the cold-responsive transcriptome

Affiliations

Disruption of the Arabidopsis circadian clock is responsible for extensive variation in the cold-responsive transcriptome

Zuzanna Bieniawska et al. Plant Physiol. 2008 May.

Abstract

In plants, low temperature causes massive transcriptional changes, many of which are presumed to be involved in the process of cold acclimation. Given the diversity of developmental and environmental factors between experiments, it is surprising that their influence on the identification of cold-responsive genes is largely unknown. A systematic investigation of genes responding to 1 d of cold treatment revealed that diurnal- and circadian-regulated genes are responsible for the majority of the substantial variation between experiments. This is contrary to the widespread assumption that these effects are eliminated using paired diurnal controls. To identify the molecular basis for this variation, we performed targeted expression analyses of diurnal and circadian time courses in Arabidopsis (Arabidopsis thaliana). We show that, after a short initial cold response, in diurnal conditions cold reduces the amplitude of cycles for clock components and dampens or disrupts the cycles of output genes, while in continuous light all cycles become arrhythmic. This means that genes identified as cold-responsive are dependent on the time of day the experiment was performed and that a control at normal temperature will not correct for this effect, as was postulated up to now. Time of day also affects the number and strength of expression changes for a large number of transcription factors, and this likely further contributes to experimental differences. This reveals that interactions between cold and diurnal regulation are major factors in shaping the cold-responsive transcriptome and thus will be an important consideration in future experiments to dissect transcriptional regulatory networks controlling cold acclimation. In addition, our data revealed differential effects of cold on circadian output genes and a unique regulation of an oscillator component, suggesting that cold treatment could also be an important tool to probe circadian and diurnal regulatory mechanisms.


Figures

Figure 1.
Figure 1.
Diurnal regulation makes major contributions to cold-responsive transcriptome differences between experiments. PCA was performed on several independent studies investigating gene expression after 1 d of cold treatment (Table I). GCRMA expression estimates (Wu et al., 2004) were used to calculate the cold minus control log2 differences. Probe sets that were detected in at least one experiment were retained. Data were mean centered and plotted using classical PCA (Stacklies et al., 2007). Samples from each experiment are denoted by letters, with lowercase denoting soil-grown plants. Colors indicate the light regime: red, continuous light for control and cold; blue, diurnal for control and continuous light for cold; green, diurnal for control and cold. A, PC 1 versus PC 2. B, PC 3 versus PC 4. Axis labels indicate the proportion of the total variance explained by each PC and the P value (Fisher's exact test) for the significance of the overlap between the top 500 genes contributing to it and those that are diurnally regulated (Blasing et al., 2005; Table II). [See online article for color version of this figure.]
Figure 2.
Figure 2.
Circadian-regulated genes make coordinated phase-specific contributions to the major differences between experiments. Following PCA (Fig. 1) to identify the main differences between independent experiments to identify cold-responsive genes, we extracted the top 500 genes contributing to PC 1 to PC 5. These genes were separated into those that contributed positively (blue) or negatively (red) to the separation. To visualize the time of day these genes have maximum expression, the numbers and the phases of those genes classified as circadian regulated (Edwards et al., 2006) are plotted for each PC. [See online article for color version of this figure.]
Figure 3.
Figure 3.
The oscillations of circadian clock components are dampened in light-dark cycles in the cold. Targeted expression analysis for several circadian clock (black panel labels), circadian output (dark red panel labels), and cold-regulated (blue panel labels) genes was performed using qRT-PCR. Plants were grown under warm diurnal conditions under normal light in long days (16 h) before transfer to 4°C at 8 h after dawn. Whole rosettes were sampled from individual plants every 4 h across the 1st d in warm conditions and for days 1, 2, 7, and 14 in the cold. The y axes show raw expression (Ct; log2 scale) values normalized by subtracting the mean of three control genes. The x axes show time after dawn, with night shown in dark gray. Data are means from three biological replicate plants. sd values are not shown for clarity but averaged 0.3 Ct.
Figure 4.
Figure 4.
The oscillations of circadian clock components are stopped in continuous light in the cold. Targeted expression analysis for several circadian clock (black panel labels), circadian output (dark red panel labels), and cold-regulated (blue panel labels) genes was performed using qRT-PCR. Plants were grown under warm diurnal conditions under low light in long days (16 h) before transfer to continuous light at 20°C or 4°C at 14 h after dawn. Whole rosettes were sampled from individual plants every 4 h until 58 h. The y axes show raw expression (Ct; log2 scale) values normalized by subtracting the mean of three control genes. The x axes show time after subjective dawn, with subjective night shown in light gray. Data are means from three biological replicate plants. sd values are not shown for clarity but averaged 0.5 Ct.
Figure 5.
Figure 5.
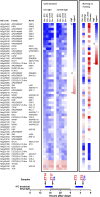
Diurnal gating of cold-responsive TFs. qRT-PCR for 1,880 Arabidopsis TFs was used to select strongly cold-responsive TFs (>4-fold change) using pooled samples from two independent experiments. Data are presented for the 60 TFs that were subsequently confirmed to change significantly using within-experiment biological replicates. Prior to the experiments, plants were grown under warm diurnal conditions at either low or normal light in long days (16 h). Plants were then transferred to 4°C (or simulated control transfer) at 2 h (ZT2) or 14 h (ZT14) after dawn. Whole rosettes were sampled from control plants before cold (ZT2 and ZT14), from paired diurnal controls (ZT5 and ZT17), or from plants cold treated for 3 h at ZT2 (Cm) or ZT14 (Ce). The sampling scheme and sample names are illustrated at the bottom. Only the 56 up-regulated and four down-regulated TFs that were significantly (P < 0.05, t test) induced at least 4-fold against both controls in both experiments for either ZT2 and/or ZT14 are shown. Normalized values were compared to generate log2 ratios between samples of interest, and these were used to plot heat maps. The left panel shows cold induction versus the time zero and paired control for each experiment, indicating gating of relative induction. The first column of the right panel shows absolute gating as the difference between the expression attained after morning cold treatment at ZT2 (Cm) versus evening cold treatment at ZT14 (Ce). The second column reveals diurnal regulation by the difference in expression between ZT2 and ZT14. Data are mean log2 ratios from five replicates.
Figure 6.
Figure 6.
Experiment-specific bias in the cold response of circadian-regulated genes that peak at different phases of the day. The overlap between circadian-regulated genes that peak at different phases (Edwards et al., 2006) of the day (ZT, time after subjective dawn) and those responding to cold in independent studies (Table I) were compared. For direct comparability, we selected the 1,000 most induced (blue) and 1,000 most repressed (red) genes in each experiment and made the comparison using Fisher's exact test. Experiments are lettered as in Table I and labeled as in Figure 1; lowercase letters denote soil-grown plants. Colors indicate the light regime: red, continuous light for control and cold; blue, diurnal for control and continuous light for cold; green, diurnal for control and cold. The bars show the log odds ratios, which show whether the genes at a specific phase are more or less likely to be cold responsive than expected by chance. Significance (false discovery rate-corrected P < 0.05) is denoted by solidly colored bars, while nonsignificant log odd ratios are shown in hatched bars. [See online article for color version of this figure.]
Figure 7.
Figure 7.
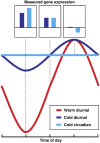
Simple model to illustrate the time-of-day effects on the identity of cold-responsive genes. In the cold, many genes, particularly of the core oscillator, show low-amplitude cycles in diurnal conditions, while in continuous light (circadian conditions) they stop to cycle. Therefore, even when paired controls are used, there are considerable time-of-day effects on measured gene expression changes. In reality, diurnal gating of gene expression, phase advances, and delays as well as the continued cycles of many genes mean that time-of-day influences will be much greater and more diverse than illustrated. [See online article for color version of this figure.]

References

    1. Alabadi D, Oyama T, Yanovsky MJ, Harmon FG, Mas P, Kay SA (2001) Reciprocal regulation between TOC1 and LHY/CCA1 within the Arabidopsis circadian clock. Science 293 880–883 - PubMed
    1. Alonso-Blanco C, Gomez-Mena C, Llorente F, Koornneef M, Salinas J, Martinez-Zapater JM (2005) Genetic and molecular analyses of natural variation indicate CBF2 as a candidate gene for underlying a freezing tolerance quantitative trait locus in Arabidopsis. Plant Physiol 139 1304–1312 - PMC - PubMed
    1. Balasubramanian S, Sureshkumar S, Lempe J, Weigel D (2006) Potent induction of Arabidopsis thaliana flowering by elevated growth temperature. PLoS Genet 2 e106. - PMC - PubMed
    1. Barrett T, Troup DB, Wilhite SE, Ledoux P, Rudnev D, Evangelista C, Kim IF, Soboleva A, Tomashevsky M, Edgar R (2007) NCBI GEO: mining tens of millions of expression profiles. Database and tools update. Nucleic Acids Res 35 D760–D765 - PMC - PubMed
    1. Bastow R, Mylne JS, Lister C, Lippman Z, Martienssen RA, Dean C (2004) Vernalization requires epigenetic silencing of FLC by histone methylation. Nature 427 164–167 - PubMed

Publication types

MeSH terms

Substances