. 2008 May;147(1):316-30.
doi: 10.1104/pp.108.115733. Epub 2008 Mar 28.

Principal transcriptional programs regulating plant amino acid metabolism in response to abiotic stresses

Affiliations

Principal transcriptional programs regulating plant amino acid metabolism in response to abiotic stresses

Hadar Less et al. Plant Physiol. 2008 May.

Abstract

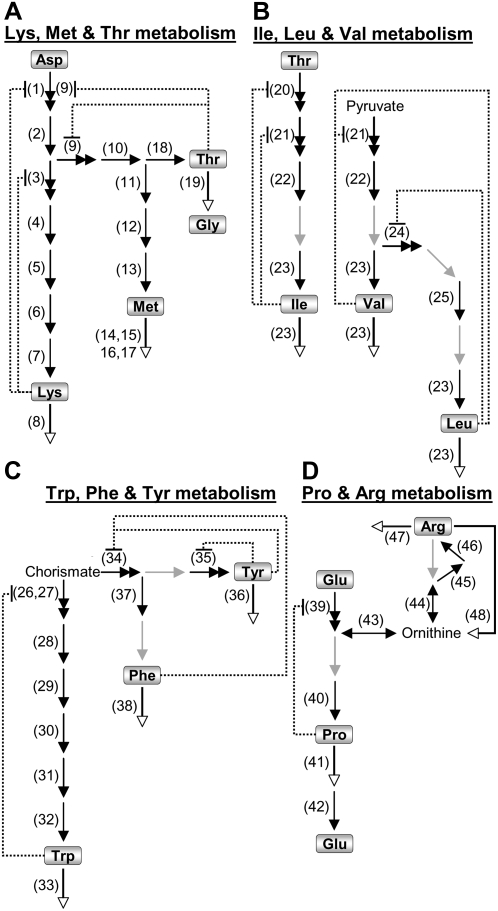
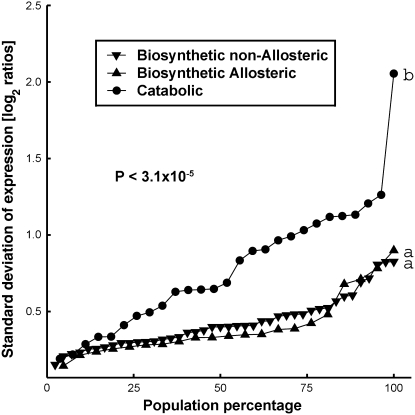
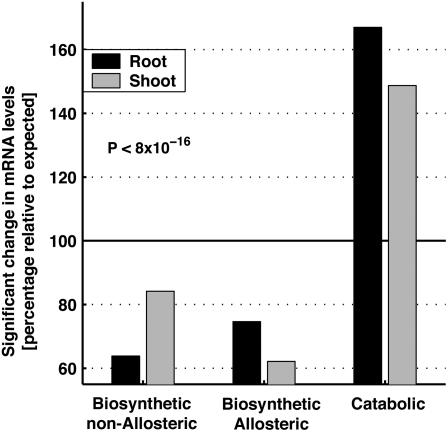
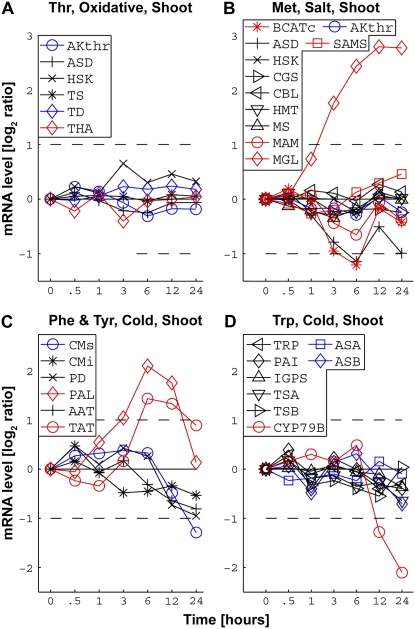
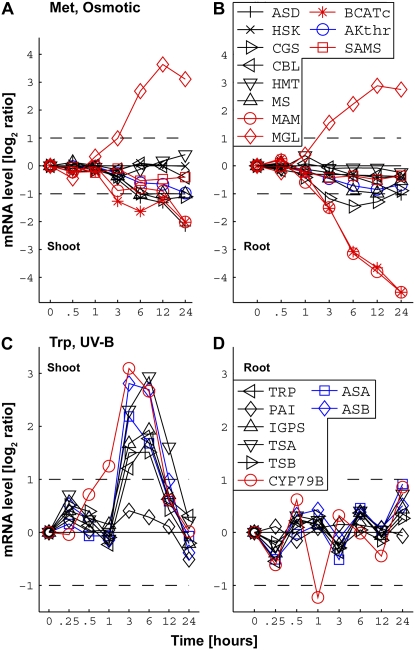
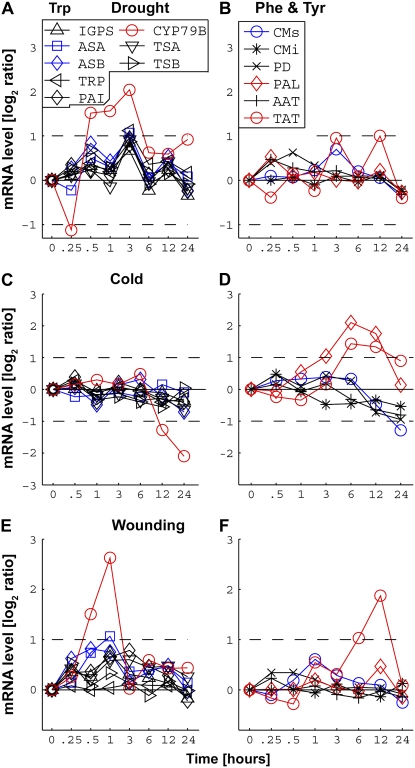
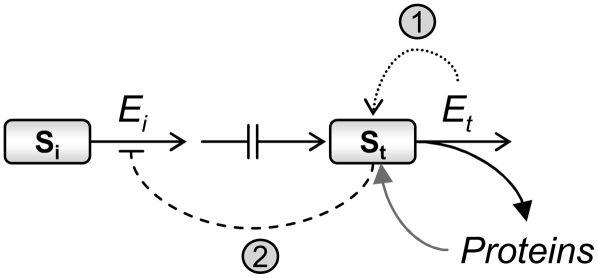
Using a bioinformatics analysis of public Arabidopsis (Arabidopsis thaliana) microarray data, we propose here a novel regulatory program, combining transcriptional and posttranslational controls, which participate in modulating fluxes of amino acid metabolism in response to abiotic stresses. The program includes the following two components: (1) the terminal enzyme of the module, responsible for the first catabolic step of the amino acid, whose level is stimulated or repressed in response to stress cues, just-in-time when the cues arrive, principally via transcriptional regulation of its gene; and (2) the initiator enzyme of the module, whose activity is principally modulated via posttranslational allosteric feedback inhibition in response to changes in the level of the amino acid, just-in-case when it occurs in response to alteration in its catabolism or sequestration into different intracellular compartments. Our proposed regulatory program is based on bioinformatics dissection of the response of all biosynthetic and catabolic genes of seven different pathways, involved in the metabolism of 11 amino acids, to eight different abiotic stresses, as judged from modulations of their mRNA levels. Our results imply that the transcription of the catabolic genes is principally more sensitive than that of the biosynthetic genes to fluctuations in stress-associated signals. Notably, the only exception to this program is the metabolic pathway of Pro, an amino acid that distinctively accumulates to significantly high levels under abiotic stresses. Examples of the biological significance of our proposed regulatory program are discussed.


Figures

Figure 1.
Figure 1.
Schematic representation of the four different metabolite networks analyzed in this report. The positions of the different amino acids in the different networks are marked with boxes. Biosynthetic/allosteric, biosynthetic/nonallosteric, and catabolic enzymatic steps are indicated by double-headed, black, and white-headed arrows, respectively, while enzymatic steps with no known genes are indicated by gray arrows. Numbers near each arrow refer to enzyme names provided in Table I. A, The network of Lys, Met, and Thr metabolism, composed of three pathways (from Asp to Lys, from Asp to Met, and from Asp to Thr). B, The network of Ile, Leu, and Val metabolism, composed of three pathways (from Thr to Ile, from pyruvate to Val, and from pyruvate to Leu), which were analyzed together (as one pathway). C, The network of Trp, Phe, and Tyr metabolism, composed of tree pathways (from chorismate to Trp, from chorismate to Phe, and from chorismate to Tyr), from which the pathways leading to Phe and Tyr were analyzed together (as one pathway). D, The network of Pro and Arg metabolism, composed of two pathways (from Glu and Orn to Pro and from Glu and Orn to Arg), which were analyzed together (as one pathway). The reasons for the definition and joining of the different pathways are explained in the text. Dotted lines ending with a bar sign represent feedback inhibition loops.
Figure 2.
Figure 2.
Distribution of the degree of fluctuations of mRNA levels of the entire sets of biosynthetic/nonallosteric (inverted triangles), biosynthetic/allosteric (triangles), and enzymes catalyzing the first catabolic step of the amino acids (circles) genes of the four metabolic networks described in Figure 1 in response to eight different abiotic stresses (both in shoots and roots). The degree of fluctuation of the mRNA levels was estimated using sd of expression (log2 ratio of treatments versus controls), and the values in each group were sorted along the x axis. Different letters (a and b at the right of each curve) represent statistically significantly different groups (P < 3.1 × 10⁻⁵).
Figure 3.
Figure 3.
Comparison of the relative number of cases in which mRNA levels of genes belonging to each of the groups of the biosynthetic/nonallosteric enzymes, biosynthetic/allosteric enzymes, and the enzymes catalyzing the first catabolic step of the amino acids, derived from the four metabolic networks described in Figure 1, in response to the eight different abiotic stresses. Results are presented for roots and shoots separately. Each histogram represents the actual number of cases in which a statistically significant response was observed relative to the expected number of cases assuming no preferential response of each of the groups (see “Materials and Methods” for details). The hypothesis of no preferential response was rejected using a χ2 test (P < 8 × 10⁻¹⁶).
Figure 4.
Figure 4.
The responses of combined isozymic mRNA levels of genes encoding isozymes of exemplary metabolic pathways to representative stress conditions in shoots. The combined isozymic mRNA levels of genes encoding biosynthetic/allosteric enzymes, biosynthetic/nonallosteric enzymes, and enzymes catalyzing the first catabolic steps of the amino acids are indicated by blue, black, and red lines, respectively. The names of the enzymes encoded by the different isozymic genes, as provided in Table I, are given in the boxes of each panel. A, Response of the Thr pathway to oxidative stress. B, Response of the Met pathway to salt stress. C, Response of the Phe and Tyr pathway to cold stress. D, Response of the Trp pathway to cold stress. The changes in mRNA levels are given in log2 ratios of treatments versus controls (y axes on the left). Only values greater than 2-fold increased or 2-fold decreased in mRNA levels (broken horizontal lines) were considered to be significant changes.
Figure 5.
Figure 5.
Comparative responses between shoots and roots of combined isozymic mRNA levels of genes encoding isozymes of exemplary metabolic pathways to representative stress conditions. The combined isozymic mRNA levels of genes encoding biosynthetic/allosteric enzymes, biosynthetic/nonallosteric enzymes, and enzymes catalyzing the first catabolic steps of the amino acids are indicated by blue, black, and red lines, respectively. The names of the enzymes encoded by the different isozymic genes, as provided in Table I, are given in the boxes in B (for A and B) and in D (for C and D). A and B, Comparative responses of the Met pathway to osmotic stress in shoots and roots. C and D, Comparative responses of the Trp pathway to UV-B stress in shoots and roots. The changes in mRNA levels are given in log2 ratios of treatments versus controls (y axes on the left). Only values greater than 2-fold increased or 2-fold decreased in mRNA levels (broken horizontal lines) were considered to be significant changes.
Figure 6.
Figure 6.
Comparative responses of the combined isozymic mRNA levels of genes encoding isozymes of the closely related Trp (A, C, and E) and Phe and Tyr (B, D, and F) pathways to various stress conditions. A and B, Drought stress. C and D, Cold stress. E and F, Wounding stress. The combined isozymic mRNA levels of genes encoding biosynthetic/allosteric enzymes, biosynthetic/nonallosteric enzymes, and enzymes catalyzing the first catabolic steps of the amino acids are indicated by blue, black, and red lines, respectively. The names of the enzymes encoded by the different isozymic genes, as provided in Table I, are given in the boxes in A (for A, C, and E) and in B (for B, D, and F). The changes in mRNA levels are given in log2 ratios of treatments versus controls (y axes on the left). Only values greater than 2-fold increased or 2-fold decreased in mRNA levels (broken horizontal lines) were considered to be significant changes.
Figure 7.
Figure 7.
The distribution of the mean expression levels (log2 ratio of treatment versus control) of genes encoding total annotated proteases (A) and the subset of proteases that are induced in senescence and PCD (B) in individual time points of the entire set of abiotic stresses. The distribution of the mean mRNA levels was estimated using 10 bins ranging from lowest to highest mean mRNA levels. Arrows in B show the mean expression levels of the genes encoding the senescence/PCD subset of proteases in response to senescence and PCD (Buchanan-Wollaston et al., 2005).
Figure 8.
Figure 8.
Schematic representation of the proposed regulatory metabolic module. The regulatory steps are as follows. The major controller of the module is the gene encoding the catabolic enzyme Et, catalyzing the first catabolic step of the amino acid. Its upregulation stimulates the module by reducing the level of its substrate (St), namely, the amino acid (step 1; dotted curved arrow). Reduced levels of St stimulate the activity of allosteric biosynthetic Ei enzymes by reduction of its feedback inhibition by St (step 2; dashed curved line), stimulating the flux through the entire module. The broken line represents all biosynthetic/nonallosteric steps. The pool of the amino acid may also be determined by the extent of its incorporation into proteins (curved black arrow) and by the extent of protein breakdown (curved gray arrow). Our proposed module may also fit to actively growing (nonsenescence) tissues of plants grown under favorable (nonstress) conditions in which the catabolic enzymes are generally repressed, but the incorporation of the amino acids into proteins (black curved arrow) may transiently reduce the level of the amino acid (St) and as a consequence enhance the flux through the metabolic module by transiently reducing the feedback inhibition on the allosteric enzyme Ei.

References

    1. Amir R, Hacham Y, Galili G (2002) Cystathionine gamma-synthase and threonine synthase operate in concert to regulate carbon flow towards methionine in plants. Trends Plant Sci 7 153–156 - PubMed
    1. Buchanan-Wollaston V, Page T, Harrison E, Breeze E, Lim PO, Nam HG, Lin JF, Wu SH, Swidzinski J, Ishizaki K, Leaver CJ (2005) Comparative transcriptome analysis reveals significant differences in gene expression and signalling pathways between developmental and dark/starvation-induced senescence in Arabidopsis. Plant J 42 567–585 - PubMed
    1. Dixon RA, Paiva NL (1995) Stress-induced phenylpropanoid metabolism. Plant Cell 7 1085–1097 - PMC - PubMed
    1. Domany E (2005) Analysis of DNA-chip and antigen-chip data: studies of cancer, stem cells and autoimmune diseases. Comput Phys Commun 169 183–187
    1. Galili G (1995) Regulation of lysine and threonine synthesis. Plant Cell 7 899–906 - PMC - PubMed

Publication types