. 2008 Jun;294(6):H2435-43.
doi: 10.1152/ajpheart.01190.2007. Epub 2008 Mar 28.

Characterization of the structural and functional changes in the myocardium following focal ischemia-reperfusion injury

Affiliations

Characterization of the structural and functional changes in the myocardium following focal ischemia-reperfusion injury

Navdeep Ojha et al. Am J Physiol Heart Circ Physiol. 2008 Jun.

Abstract

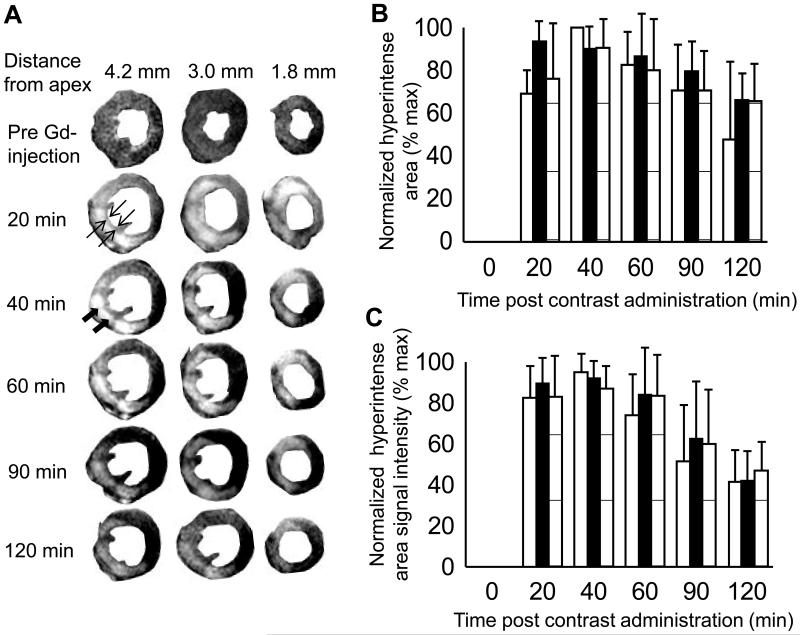
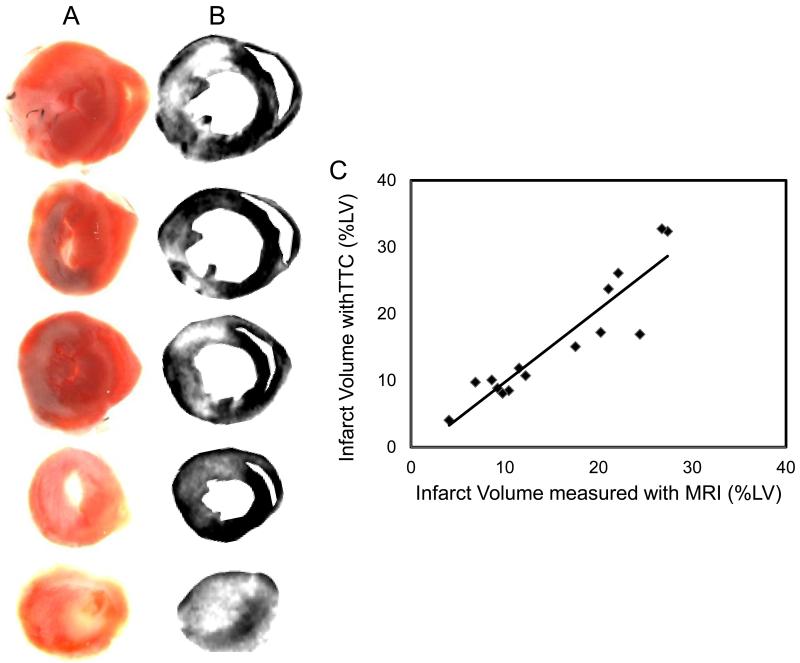
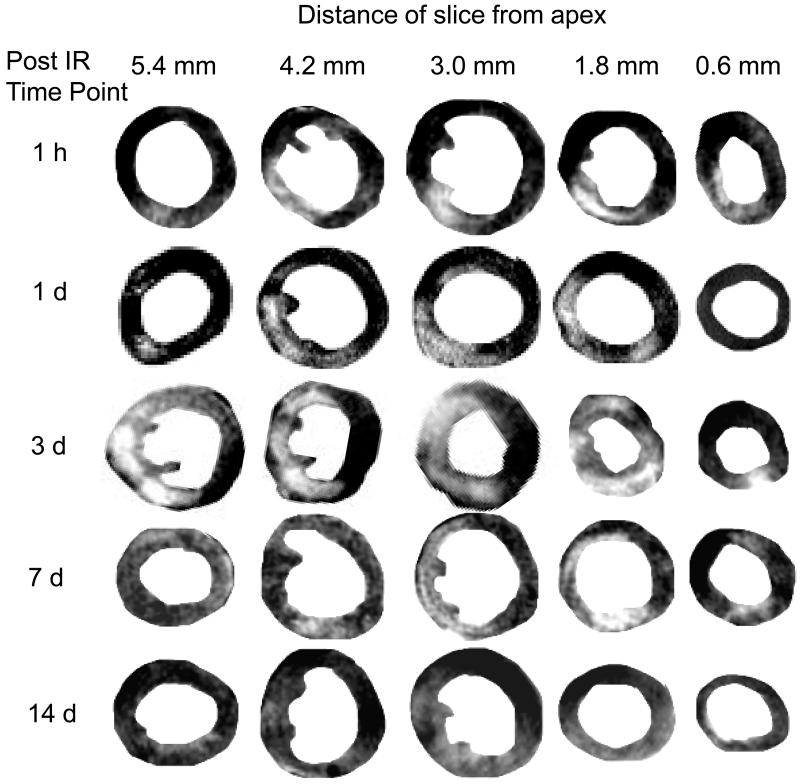
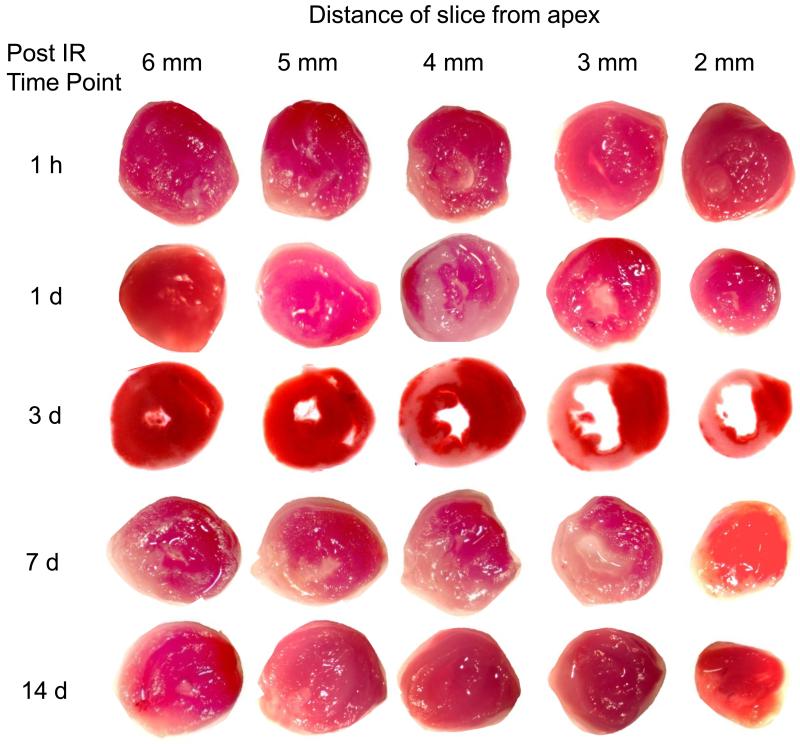
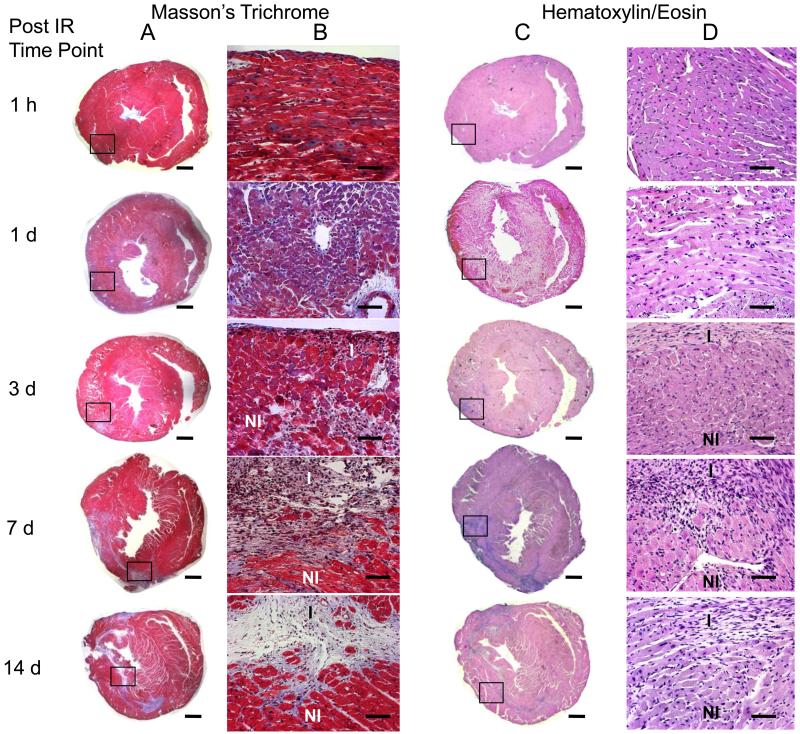
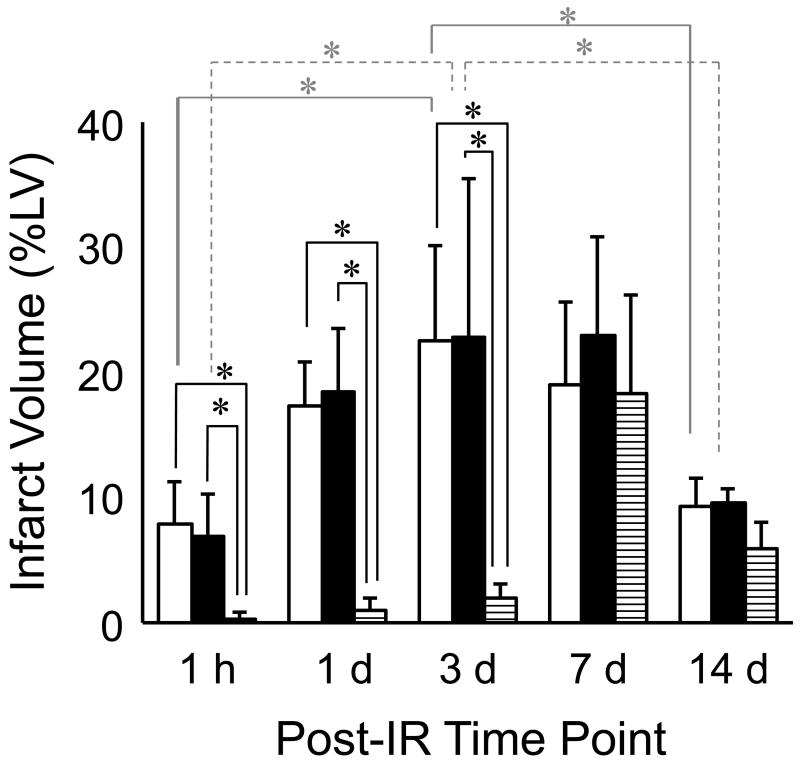
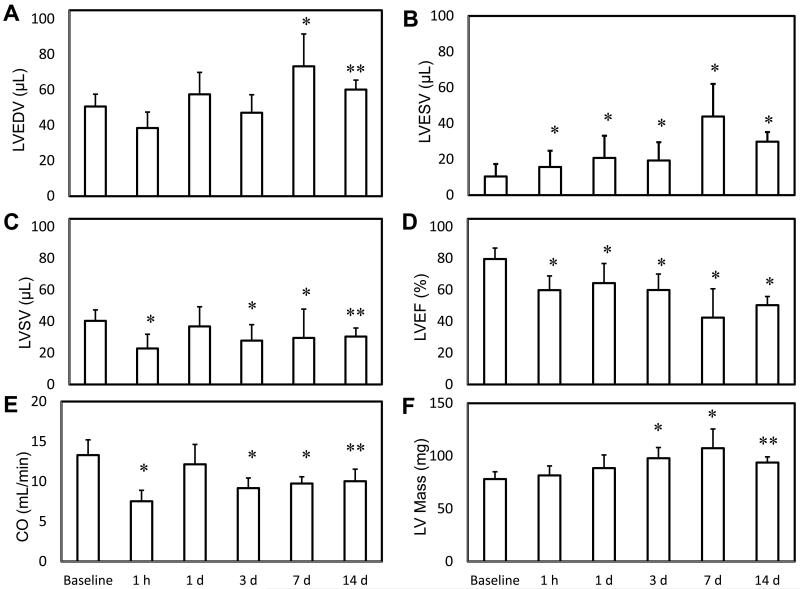
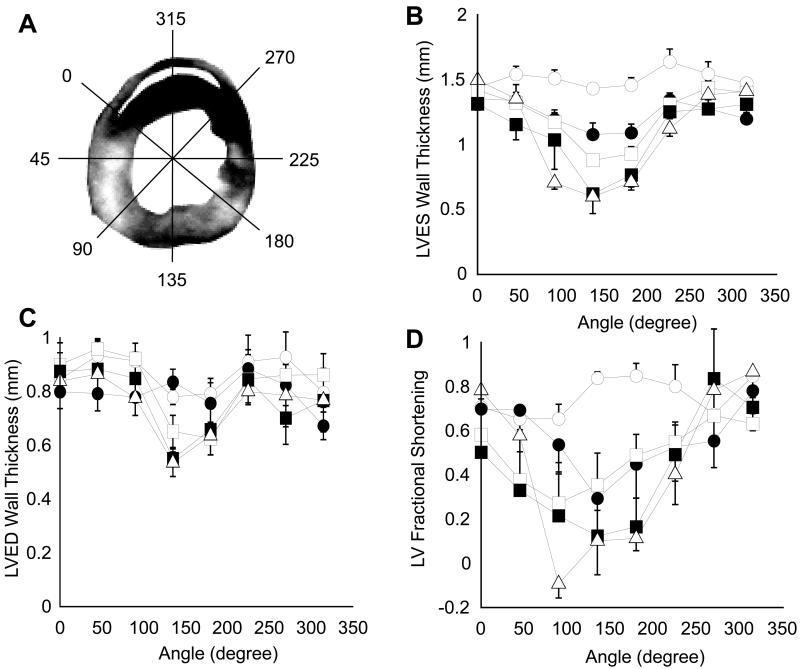
High-resolution (11.7 T) cardiac magnetic resonance imaging (MRI) and histological approaches have been employed in tandem to characterize the secondary damage suffered by the murine myocardium following the initial insult caused by ischemia-reperfusion (I/R). I/R-induced changes in the myocardium were examined in five separate groups at the following time points after I/R: 1 h, day 1, day 3, day 7, and day 14. The infarct volume increased from 1 h to day 1 post-I/R. Over time, the loss of myocardial function was observed to be associated with increased infarct volume and worsened regional wall motion. In the infarct region, I/R caused a decrease in end-systolic thickness coupled with small changes in end-diastolic thickness, leading to massive wall thickening abnormalities. In addition, compromised wall thickening was also observed in left ventricular regions adjacent to the infarct region. A tight correlation (r2 = 0.85) between measured MRI and triphenyltetrazolium chloride (TTC) infarct volumes was noted. Our observation that until day 3 post-I/R the infarct size as measured by TTC staining and MRI was much larger than that of the myocyte-silent regions in trichrome- or hematoxylin-eosin-stained sections is consistent with the literature and leads to the conclusion that at such an early phase, the infarct site contains structurally intact myocytes that are functionally compromised. Over time, such affected myocytes were noted to structurally disappear, resulting in consistent infarct sizes obtained from MRI and TTC as well as trichrome and hematoxylin-eosin analyses on day 7 following I/R. Myocardial remodeling following I/R includes secondary myocyte death followed by the loss of cardiac function over time.


Figures

Figure 1
Figure 1. Time course of signal enhancement in heart after contrast agent administration
Contrast agent Gd-DTPA-BMA was injected IP (0.6-0.9 mM/kg body weight) in a mouse 3 days after 60 minute transient LAD occlusion surgery. The mouse was then immediately placed into the MRI and data acquisition was started. Contrast enhanced images were acquired with an inversion recovery pulse sequence with TI 150-200 ms. (A)Time course of signal enhancement in three heart slices is shown with contrast enhanced regions indicating myocardial tissue damage. MR images were segmented with Photoshop for better display of left ventricle. Solid arrows indicate region of hyperintensity which was interpreted as infarct. Open arrows indicate a thin layer of viable tissue between the infarct region and LV lumen, which aided in infarct segmentation and planimetry. (B) Hyper intense area on each image remains constant from 40-60 minutes post contrast administration. MR slices in left column of A are represented by open bars, middle column by solid bars, and right column by striped bars. (C) Signal Intensity of hyper intense region was normalized to maximum level of each slice. Peak signal intensity was observed 40 minutes after contrast agent administration. Thus, all contrast enhanced images in this study were acquired 30-45 minutes after contrast agent administration.
Figure 2
Figure 2. Contrast-enhanced mouse heart MR images compared with corresponding tissue slices photographed post-mortem
(A) MR images were obtained 3 days after 60 minute occlusion of LAD coronary artery and 40 minutes after injection of Gd-DTPA-BMA contrast agent. (B) Color images obtained by digital photography of corresponding tissue sections stained with TTC. (C) Good correlation (r2 = 0.85) was found between spatial location and extent of myocardial damage delineated by enhanced regions (white) in MR images and necrotic regions (white) not stained red by TTC. Best-fit linear trendline is drawn through the individual data points.
Figure 3
Figure 3. MRI assessment of infarct size at different time-points post-IR
Five groups of mice were imaged at 5 time points after 60 minute transient LAD occlusion and reperfusion. MRI protocol was as described in the text. Five sequential tissue slices from each animal are shown, where slice thickness is 1 mm and distance of center of slice from apex is given. Infarct volume was calculated with planimetry at each time point. Maximal infarct damage was observed 3 days after surgery (n=5 in 1h group, n=6 in 1d group, n=9 in 3d group, n=7 in 7d group and n=4 in 14d group).
Figure 4
Figure 4
TTC assessment of infarct size at different time-points post IR. Myocardial TTC staining was performed on animals immediately after MRI experiment was completed on each of the five time points. 1 mm thick heart slices were incubated with 2% TTC for 20 minutes at 37°C and digitally photographed. Infarct volume was calculated from TTC images with manual delineation of necrotic region (white) using digital planimetry (n = 15).
Figure 5
Figure 5
Histological assessment of infarct size at different time-points post IR. Tissue sections were obtained from formalin fixed heart slices that had been used for TTC staining. H/E and Masson’s trichrome staining was done on four representative sections obtained from each 1 mm tissue slice. Infarct on H/E stained sections was defined as regions without myocytes and rich with atypical nuclei. Collagen accumulation in the five groups of mice was assessed by the blue color on Masson’s trichrome staining. Infarct volume was calculated by manual delineation of infarct region on H/E stained sections using a digital camera mounted on a microscope. Images shown here represent heart sections from 4 mm above the apex. Images shown in column A and C were taken at 1.25× magnification (scale bar = 1 mm). Columns B and D show magnified view at 20× magnification of boxed region (scale bar = 50 μm). Maximum loss of myocytes and collagen accumulation were observed at 7 days after IR injury (n = 4 at each time point).
Figure 6
Figure 6
Infarct volume as measured by 3 different techniques at different time-points post IR. Infarct volume was calculated using MRI (open bars), TTC (solid bars) and H&E histology (striped bars) using digital planimetry at 1 h, 1 d, 3 d, 7 d and 14 d after IR surgery. Infarct volume was calculated as a percentage of left ventricular myocardial volume. MRI and TTC data were closely associated with each other at all time points, but not with histologically defined infarct volume. A statistically significant change in TTC and MRI infarct volume was observed between time points 1h and 3d, and between 3d and 14d post IR (n=4 in each group at each time point).
Figure 7
Figure 7
MRI analysis of cardiac function after IR injury. Global parameters of LV volume and function were measured with MRI in five groups at different time points post IR. IR caused a significant increase in LV End Diastolic Volume (A) and LV End Systolic Volume (B), while causing a significant decrease in LV Stoke Volume (C), Cardiac Output (D) and LV Ejection Fraction (E). A significant increase in LV myocardial mass was also observed after IR. * indicates p<0.01 and ** indicates p<0.05 compared to baseline values (n = 9 in baseline group, n=5 in 1h group, n=6 in 1d group, n=9 in 3d group, n=7 in 7d group and n=4 in 14d group).
Figure 8
Figure 8. Segmental LV wall thickening analysis before and after IR
(A) LV wall was segmented into 8 equiangular 45° sectors using custom written software in Matlab. Wall thickness was calculated radially at 2° increments and was averaged for each sector. Thickness data was indexed to right ventricular insertion point in the anterior wall. (B) and (C), Segmental LV wall thickness at ES and ED, respectively. (D) FS of LV wall in one cardiac cycle. Baseline data is represented by open circles, 1d by filled circles, 3d by open squares, 7d by filled squares and 14d by open triangles (n=4 in each group).

Similar articles

Cited by

References

    1. Ambrosio G, Weisman HF, Mannisi JA, Becker LC. Progressive impairment of regional myocardial perfusion after initial restoration of postischemic blood flow. Circulation. 1989;80:1846–1861. - PubMed
    1. Ambrosio G, Zweier JL, Becker LC. Apoptosis is prevented by administration of superoxide dismutase in dogs with reperfused myocardial infarction. Basic Res Cardiol. 1998;93:94–96. - PubMed
    1. Bardales RH, Hailey LS, Xie SS, Schaefer RF, Hsu SM. In situ apoptosis assay for the detection of early acute myocardial infarction. Am J Pathol. 1996;149:821–829. - PMC - PubMed
    1. Benedek A, Moricz K, Juranyi Z, Gigler G, Levay G, Harsing LG, Jr., Matyus P, Szenasi G, Albert M. Use of TTC staining for the evaluation of tissue injury in the early phases of reperfusion after focal cerebral ischemia in rats. Brain Res. 2006;1116:159–165. - PubMed
    1. Chacko VP, Aresta F, Chacko SM, Weiss RG. MRI/MRS assessment of in vivo murine cardiac metabolism, morphology, and function at physiological heart rates. Am J Physiol Heart Circ Physiol. 2000;279:H2218–2224. - PubMed

Publication types

MeSH terms