. 2008 Apr 15;68(8):2610-21.
doi: 10.1158/0008-5472.CAN-07-5250. Epub 2008 Mar 28.

The signatures of autozygosity among patients with colorectal cancer

Affiliations

The signatures of autozygosity among patients with colorectal cancer

Manny D Bacolod et al. Cancer Res. .

Abstract

Previous studies have shown that among populations with a high rate of consanguinity, there is a significant increase in the prevalence of cancer. Single nucleotide polymorphism (SNP) array data (Affymetrix, 50K XbaI) analysis revealed long regions of homozygosity in genomic DNAs taken from tumor and matched normal tissues of colorectal cancer (CRC) patients. The presence of these regions in the genome may indicate levels of consanguinity in the individual's family lineage. We refer to these autozygous regions as identity-by-descent (IBD) segments. In this study, we compared IBD segments in 74 mostly Caucasian CRC patients (mean age of 66 years) to two control data sets: (a) 146 Caucasian individuals (mean age of 80 years) who participated in an age-related macular degeneration (AMD) study and (b) 118 cancer-free Caucasian individuals from the Framingham Heart Study (mean age of 67 years). Our results show that the percentage of CRC patients with IBD segments (>or=4 Mb length and 50 SNPs probed) in the genome is at least twice as high as the AMD or Framingham control groups. Also, the average length of these IBD regions in the CRC patients is more than twice the length of the two control data sets. Compared with control groups, IBD segments are found to be more common among individuals of Jewish background. We believe that these IBD segments within CRC patients are likely to harbor important CRC-related genes with low-penetrance SNPs and/or mutations, and, indeed, two recently identified CRC predisposition SNPs in the 8q24 region were confirmed to be homozygous in one particular patient carrying an IBD segment covering the region.


Conflict of interest statement

Disclosure of Potential Conflicts of Interest

No potential conflicts of interest were disclosed.

Figures
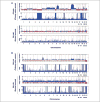
Figure 1
Figure 1
A, SNP array (Affymetrix Xba 240 50K) whole-genome analysis of the colon cancer tissue C0114A and its matching normal mucosa C0114H. The charts (copy number and LOH) were generated by Affymetrix CNAT version 3 (26). The aberrations in C0114A include losses in chromosomes 4, 22, 8p, and parts of 10 and 20p, as well as gains in chromosomes 13 and 20q. The copy number chart indicates deviations from the normal copy number of 2 (baseline of the chart). High LOH values (for the charts, the LOH value is capped at 20), indicated by tall blue bars represent segments in the chromosome of contiguous homozygous SNPs. In the CRC sample, regions of copy loss usually correspond to regions of high LOH. The matching normal (C0114H) indicates neutral copy number (equal populations of red and blue bars only represent noise) throughout the genome. B, SNP array (Affymetrix Xba 240 50K) whole-genome analysis of the colon cancer tissue C0111A and its matching normal mucosa C0111H. Unlike in C0114A (A), the regions of high homozygosity in C0111A can also be found in its corresponding normal mucosa (C0111H). These homozygous segments may in fact be indicator of genomic autozygosity in the patient C0111.
Figure 2
Figure 2
The locations of the identified IBD segments (black horizontal bars) among the genomes of the 74 colon cancer patients (A), and the AMD (B) and Framingham (C) control data sets. The threshold limit was set to a minimum of 4-Mb length encompassing at least 50 consecutive homozygous SNPs (but allowing at most 2% errors).
Figure 3
Figure 3
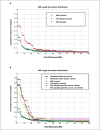
A, the cumulative distributions of the lengths of IBD segments for the CRC patients, as well as AMD and Framingham control individuals. The graph is presented in such a way that each data point represents the cumulative fraction (y axis) of the samples with the corresponding minimum cumulative IBD segment length (x axis). In other words, Y = f (Xx). The clear difference between the CRC patients and the control data sets can be seen even up to a cumulative frequency of 20 Mb IBD segment/sample. The Kolmogorov-Smirnov test showed significant differences between the CRC and AMD (P = 1.28 × 10⁻⁵), as well as between CRC and Framingham (P = 1.13 × 10⁻⁵) distributions. On the other hand, there was no significant difference between the distributions of AMD and Framingham data sets (P = 0.91). B, the cumulative distributions of the lengths of IBD segments for Jewish and non-Jewish subgroups of the CRC patients, the AMD and Framingham controls, along with AJBC and AJNC patients. Statistical comparison (Kolmogorov-Smirnov test) also showed a clear difference between the CRC Jewish and non-Jewish distributions (P = 0.0170). Nonetheless, both the percentages of samples with IBD segments and the average IBD segment size are significantly higher for non-Jewish patients compared with either the AMD (P =4.30 × 10⁻⁴) or Framingham controls (P = 1.08 × 10⁻⁴; B). We then compared the IBD segment distributions in the Ashkenazi Jewish (AJBC and AJNC) data sets with those of our CRC and control (AMD and Framingham) data sets. The IBD segment distributions of AJBC and AJNC are indistinguishable from each other (P = 0.922). However, it is very clear that the fraction of samples with at least 5 Mb total IBD length is higher in both Ashkenazi Jewish data sets than in the CRC non-Jewish, as well as AMD and Framingham data sets. Statistical comparisons show that AJBC versus AMD, AJNC versus AMD, AJBC versus Framingham, and AJNC versus Framingham have P values of 1.31 × 10⁻⁶, 9.48 × 10⁻¹⁷, 2.09 × 10⁻⁷, and 2.54 × 10⁻¹⁷, respectively. The data from AJBC and AJNC groups were generated using the more dense Affymetrix 500K SNP array. Before the comparing the IBD segments identified from the 500K and the 50K Xba array data, we identified the SNPs whose genomic positions are closely matched in the two sets (maximum separation of 10,000 bp, although 9,360 SNPs are identical, in the two array sets; see Supplement S-D2). Thus, the IBD regions identified and plotted for B were from the analyses of 39,097 SNPs.

References

    1. Jemal A, Siegel R, Ward E, Murray T, Xu J, Thun MJ. Cancer statistics, 2007. CA Cancer J Clin. 2007;57:43–66. - PubMed
    1. Parkin DM, Bray F, Ferlay J, Pisani P. Global cancer statistics, 2002. CA Cancer J Clin. 2005;55:74–108. - PubMed
    1. Ahmed FE. Colon cancer: prevalence, screening, gene expression and mutation, and risk factors and assessment. J Environ Sci Health C Environ Carcinog Ecotoxicol Rev. 2003;21:65–131. - PubMed
    1. de la Chapelle A. Genetic predisposition to colorectal cancer. Nat Rev Cancer. 2004;4:769–80. - PubMed
    1. Segditsas S, Tomlinson I. Colorectal cancer and genetic alterations in the Wnt pathway. Oncogene. 2006;25:7531–7. - PubMed

Publication types