. 2008 Apr;14(4):413-20.
doi: 10.1038/nm1741. Epub 2008 Mar 30.

CCL3L1-CCR5 genotype influences durability of immune recovery during antiretroviral therapy of HIV-1-infected individuals

Affiliations

CCL3L1-CCR5 genotype influences durability of immune recovery during antiretroviral therapy of HIV-1-infected individuals

Sunil K Ahuja et al. Nat Med. 2008 Apr.

Abstract

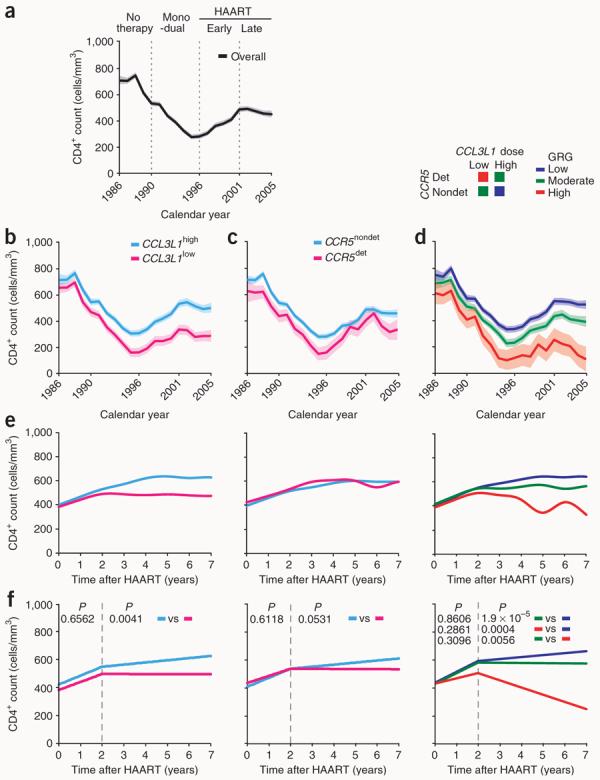
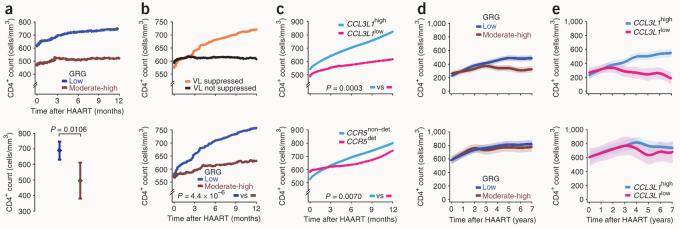
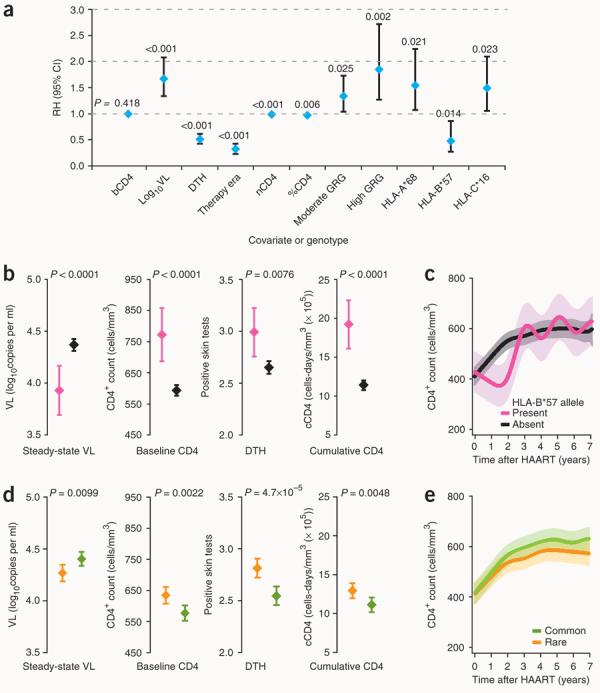
The basis for the extensive variability seen in the reconstitution of CD4(+) T cell counts in HIV-infected individuals receiving highly active antiretroviral therapy (HAART) is not fully known. Here, we show that variations in CCL3L1 gene dose and CCR5 genotype, but not major histocompatibility complex HLA alleles, influence immune reconstitution, especially when HAART is initiated at <350 CD4(+) T cells/mm(3). The CCL3L1-CCR5 genotypes favoring CD4(+) T cell recovery are similar to those that blunted CD4(+) T cell depletion during the time before HAART became available (pre-HAART era), suggesting that a common CCL3L1-CCR5 genetic pathway regulates the balance between pathogenic and reparative processes from early in the disease course. Hence, CCL3L1-CCR5 variations influence HIV pathogenesis even in the presence of HAART and, therefore, may prospectively identify subjects in whom earlier initiation of therapy is more likely to mitigate immunologic failure despite viral suppression by HAART. Furthermore, as reconstitution of CD4(+) cells during HAART is more sensitive to CCL3L1 dose than to CCR5 genotypes, CCL3L1 analogs might be efficacious in supporting immunological reconstitution.


Figures

Figure 1
Figure 1
Influence of CCL3L1-CCR5 genotypes on CD4+ T cell dynamics in the WHMC HIV+ cohort. (ad) Trajectories of CD4+ counts in the WHMC cohort across calendar years of cohort membership computed before (a) and after accounting for CCL3L1 dose (b), CCR5 genotype (c) and CCL3L1-CCR5 GRGs (d). Dotted lines in a demarcate the indicated therapy eras, and mono and dual reflect therapy with one or two antiviral agents that were prevalent during the pre-HAART era. The time trends shown were estimated by nonlinear generalized estimating equations (GEE) modeling of CD4+ counts and depicted as mean (thick lines) and 95% confidence bands (shaded regions). The genetic components that comprise CCL31-CCR5 GRGs are shown above d. (e) Trajectories of CD4+ counts (by nonlinear GEE) from time of initiation of HAART according to (from left to right) CCL3L1 dose, CCR5 genotype and CCL3L1-CCR5 GRG status. (f) Trajectories of CD4+ counts during HAART according to CCL3L1 dose, CCR5 genotype and GRG status during the first 2 years after initiation of HAART and in the years thereafter (modeled by linear GEE in two segments demarcated by the dashed lines). P values indicate differences in rate of change in CD4+ counts for the indicated groups (derived by the Student's t-test) during the first 2 years after initiation of HAART and in the years thereafter. Rate of change in CD4+ cell counts per month (with s.e.m. in parentheses) during the first 2 years of HAART in those with a high or low CCL3L1 dose, nondetrimental or detrimental CCR5 genotype, and low, moderate or high GRG were 5.23 (0.72), 4.73 (1.12), 5.29 (0.57), 4.18 (2.11), 6.36 (0.57), 6.20 (0.98), and 3.12 (2.86), respectively. Rate of change in CD4+ cell counts/month (s.e.m.) after 2 years of HAART in those with a high or low CCL3L1 dose, nondetrimental or detrimental CCR5 genotype, and low, moderate or high GRG were 1.27 (0.23), −0.04 (0.39), 1.20 (0.21), −0.05 (0.61), 0.96 (0.17), −0.09 (0.17), and −3.54 (1.22), respectively. The color code for plots shown in e and f are shown above bd.
Figure 2
Figure 2
Influence of CCL3L1-CCR5 on CD4+ recovery in subjects initiating HAART during acute or early infection (AIEDRP cohorts, a–c) and impact of the timing of HAART on effects of CCL3L1-CCR5 on CD4+ recovery in the WHMC cohort (d,e). (a) Loess curves depict trajectories of CD4+ counts in those who initiated HAART during acute infection and who attained viral load suppression according to GRG status (top). Difference in average CD4+ counts by GRG in the first year of HAART is also shown (bottom). (b) Loess curves showing CD4+ count changes in subjects according to those who did or did not achieve viral load suppression during early infection (top) and according to GRG status in those who achieved HAART-induced viral load suppression during early infection (bottom). For those initiating HAART during early infection, rate of change in CD4+ cell counts/month (s.e.m.) in those with low or moderate-high GRG were 21.62 (1.09) and 12.52 (1.59), respectively. (c) Loess curves for CD4+ count changes according to CCL3L1 dose (top) or CCR5 genotype (bottom) in subjects with HAART-induced viral load suppression during early infection. Rate of change in CD4+ counts/month (s.e.m.) in those with a high or low CCL3L1 dose and nondetrimental or detrimental CCR5 genotypes were 20.30 (1.02), 12.71 (1.79), 20.18 (0.97), and 12.56 (2.63), respectively. (d) Trajectories of CD4+ counts (mean (bold lines) and 95% confidence bands by nonlinear GEE) according to GRG status for subjects in WHMC who initiated HAART at <350 (top) or ≥350 (bottom) CD4+ cells/mm3. The data are for all subjects who received HAART. (e) Trajectories of CD4+ counts according to CCL3L1 dose in subjects who were therapy-naive and initiated HAART at <350 (top) or ≥350 CD4+ cells/mm3 (bottom). The HAART-initiating CD4+ T cell count is the average CD4+ T cell count during the year preceding initiation of therapy. Where indicated, the moderate and high GRGs were combined into a single category (brown).
Figure 3
Figure 3
Influence of HLA alleles on early events and CD4+ T cell dynamics in subjects from the WHMC HIV+ cohort. (a) Independent disease-modifying effects of HLA alleles. The plot shows the relative hazards (RH, diamonds) and 95% confidence interval (CI, error bars) for rates of progression to AIDS for the variables listed along the x-axis. Results are derived from the final model using stepwise multivariate Cox proportional hazards regression analyses for time to AIDS (1987 Centers for Disease Control criteria) and are based on data from 719 European- and African-American subjects from the WHMC HIV+ cohort. bCD4, baseline CD4+ T cell count; VL, steady-state viral load; nCD4, nadir CD4+ T cell count during HIV disease course; %CD4, percentage of baseline CD4+ T cell counts; these parameters as well as the therapy era and DTH skin test reactions are as described previously. The RH (95% CI) for bCD4, nCD4 and %CD4 are 1.00 (0.99 – 1.00), 0.99 (0.99 – 0.99) and 0.97 (0.96 – 0.99), respectively. (b) Association of the HLA-B*57 allele (pink, present; black, absent) with parameters that reflect early immune damage (steady-state VL, baseline CD4, DTH responses) and cumulative CD4+ T cell counts. Diamonds and error bars represent the mean and 95% CI, and the P values were obtained using the Student's t-test. (c) Recovery of CD4+ T cell counts after initiation of HAART on the basis of possession of a HLA-B*57 allele (by nonlinear GEE). (d) Association of HLA class I allele frequency score groups (low score representing rare (orange) and high score representing common (green) class I HLA alleles) with the indicated parameters. (e) Recovery of CD4+ T cell counts after initiation of HAART on the basis of the HLA class I allele frequency score groups representative of rare and common HLA class I alleles (by nonlinear GEE).

Comment in

  • Getting personal about treating HIV.
    Neaton JD, Lane HC. Neaton JD, et al. Nat Med. 2008 Apr;14(4):369-70. doi: 10.1038/nm0408-369. Nat Med. 2008. PMID: 18391933 No abstract available.
  • CCL3L1 and HIV/AIDS susceptibility.
    Urban TJ, Weintrob AC, Fellay J, Colombo S, Shianna KV, Gumbs C, Rotger M, Pelak K, Dang KK, Detels R, Martinson JJ, O'Brien SJ, Letvin NL, McMichael AJ, Haynes BF, Carrington M, Telenti A, Michael NL, Goldstein DB. Urban TJ, et al. Nat Med. 2009 Oct;15(10):1110-2. doi: 10.1038/nm1009-1110. Nat Med. 2009. PMID: 19812560 Free PMC article. No abstract available.

References

    1. Douek DC, Picker LJ, Koup RA. T cell dynamics in HIV-1 infection. Annu. Rev. Immunol. 2003;21:265–304. - PubMed
    1. Rodriguez B, et al. Predictive value of plasma HIV RNA level on rate of CD4 T-cell decline in untreated HIV infection. J. Am. Med. Assoc. 2006;296:1498–1506. - PubMed
    1. Dolan MJ, et al. CCL3L1 and CCR5 influence cell-mediated immunity and affect HIV-AIDS pathogenesis via viral entry–independent mechanisms. Nat. Immunol. 2007;8:1324–1336. - PubMed
    1. Moore RD, Keruly JC. CD4+ cell count 6 years after commencement of highly active antiretroviral therapy in persons with sustained virologic suppression. Clin. Infect. Dis. 2007;44:441–446. - PubMed
    1. Grabar S, et al. Clinical outcome of patients with HIV-1 infection according to immunologic and virologic response after 6 months of highly active antiretroviral therapy. Ann. Intern. Med. 2000;133:401–410. - PubMed