. 2008 Apr;14(4):392-8.
doi: 10.1038/nm1738. Epub 2008 Mar 30.

Neurotensin increases mortality and mast cells reduce neurotensin levels in a mouse model of sepsis

Affiliations

Neurotensin increases mortality and mast cells reduce neurotensin levels in a mouse model of sepsis

Adrian M Piliponsky et al. Nat Med. 2008 Apr.

Abstract

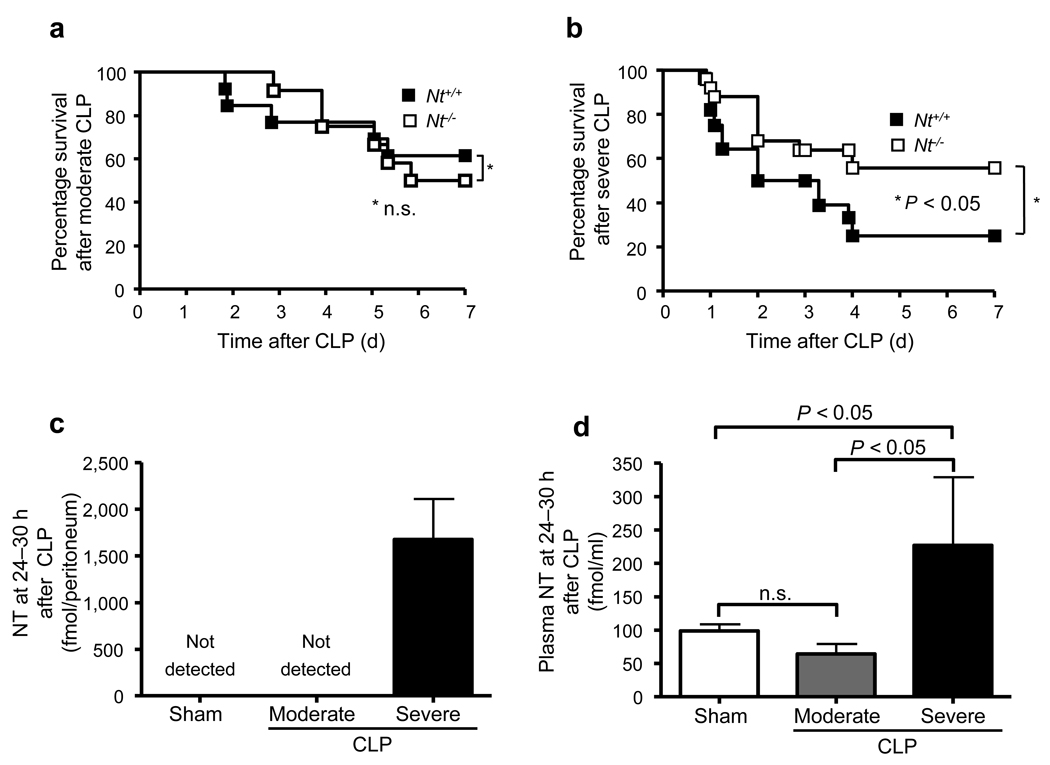
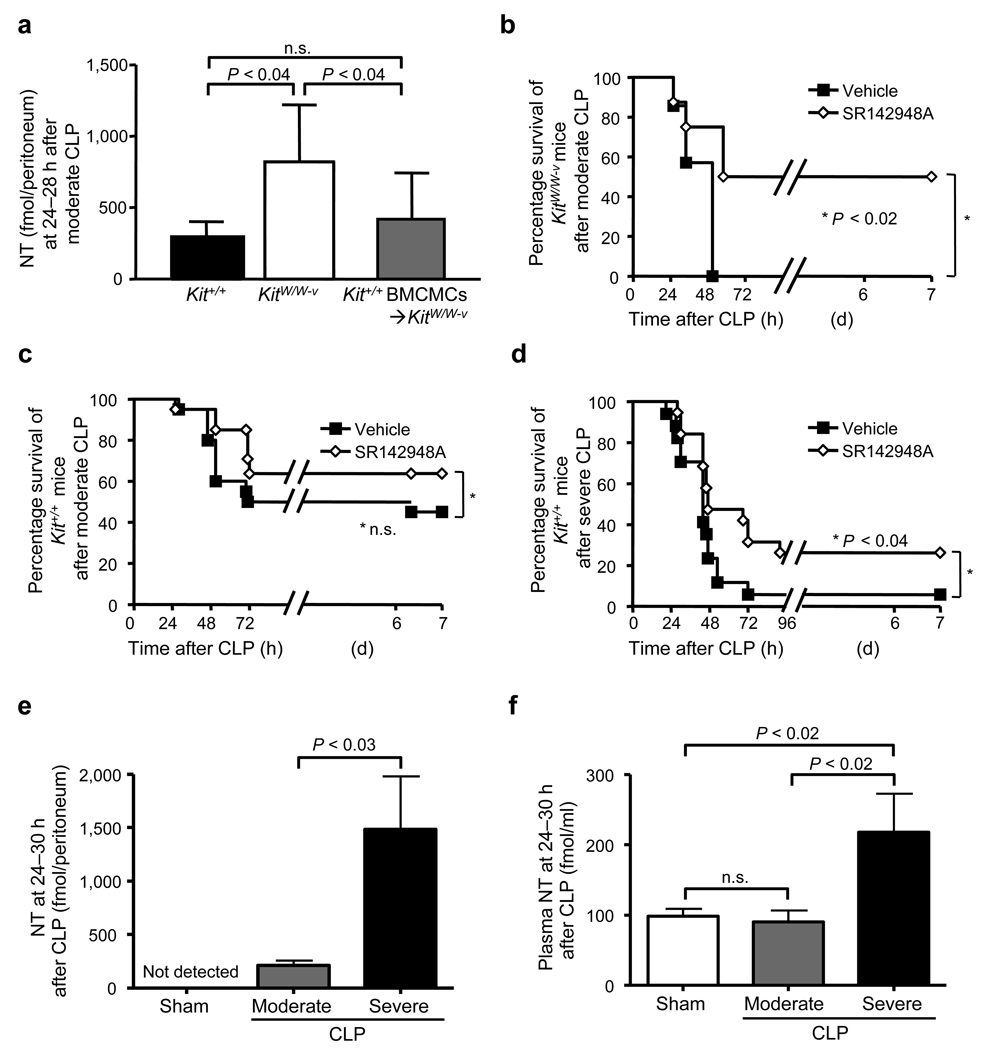
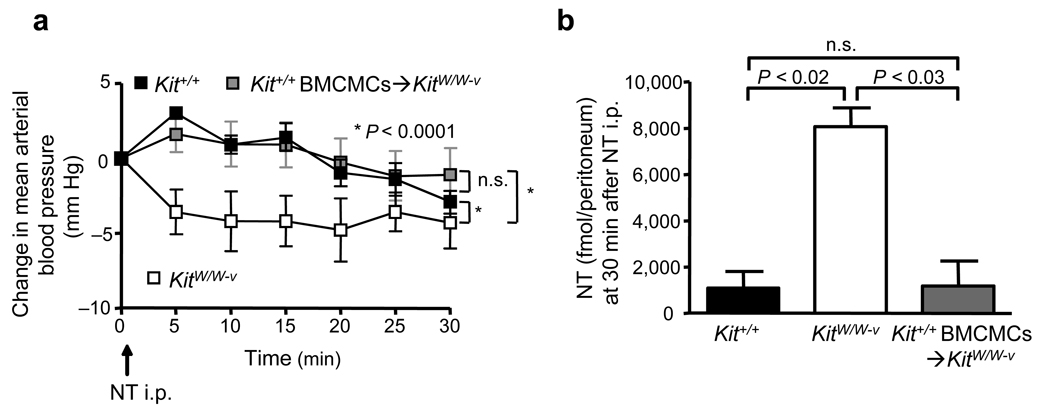
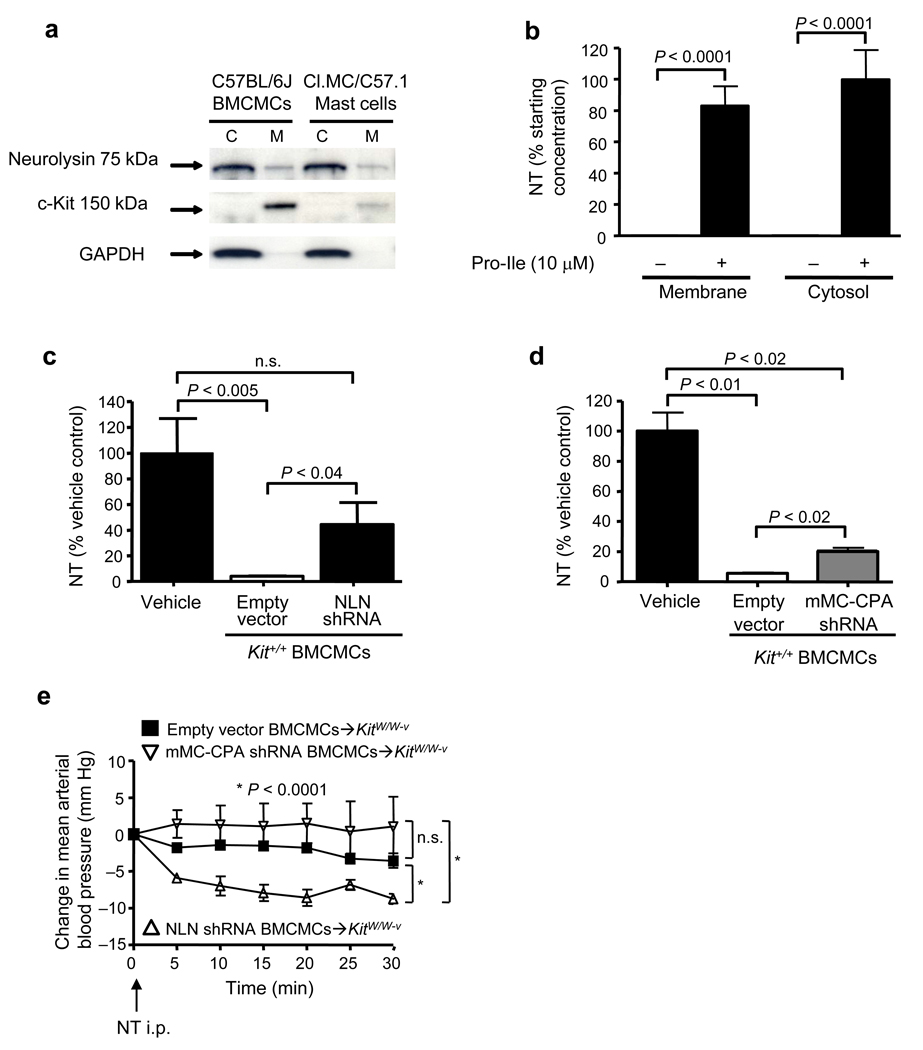
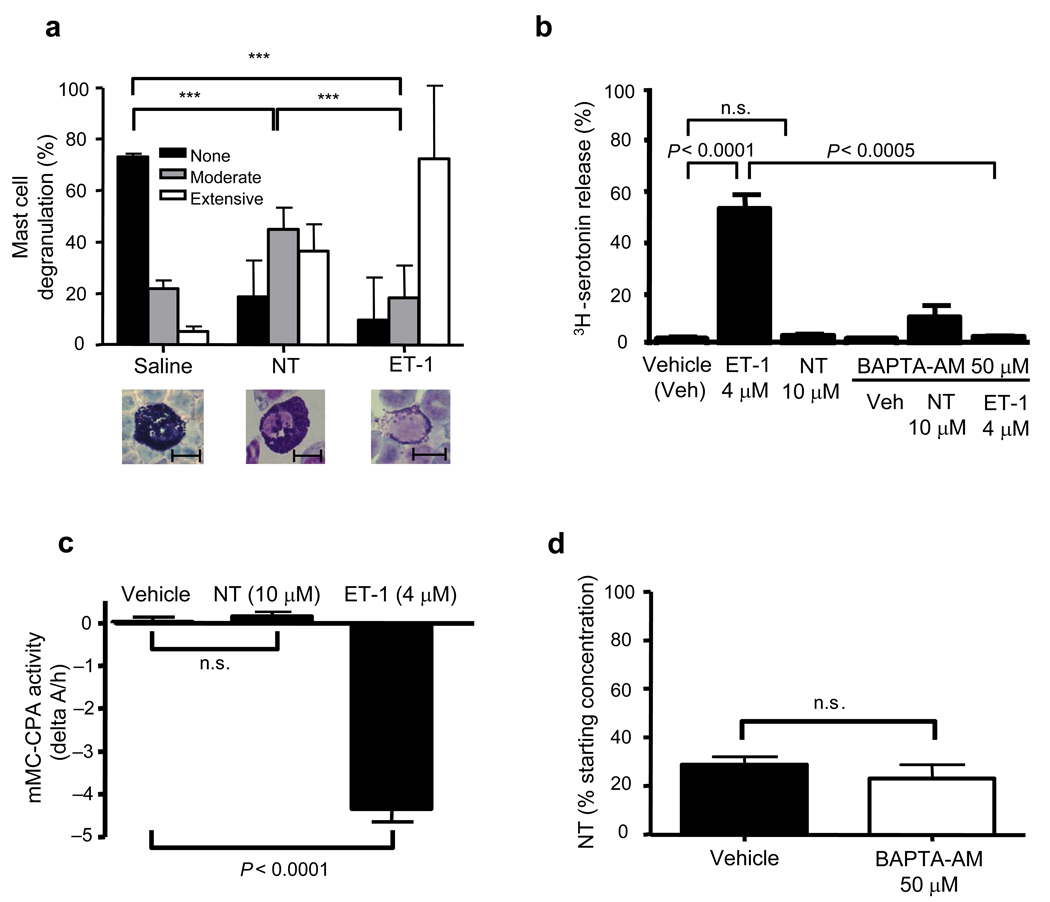
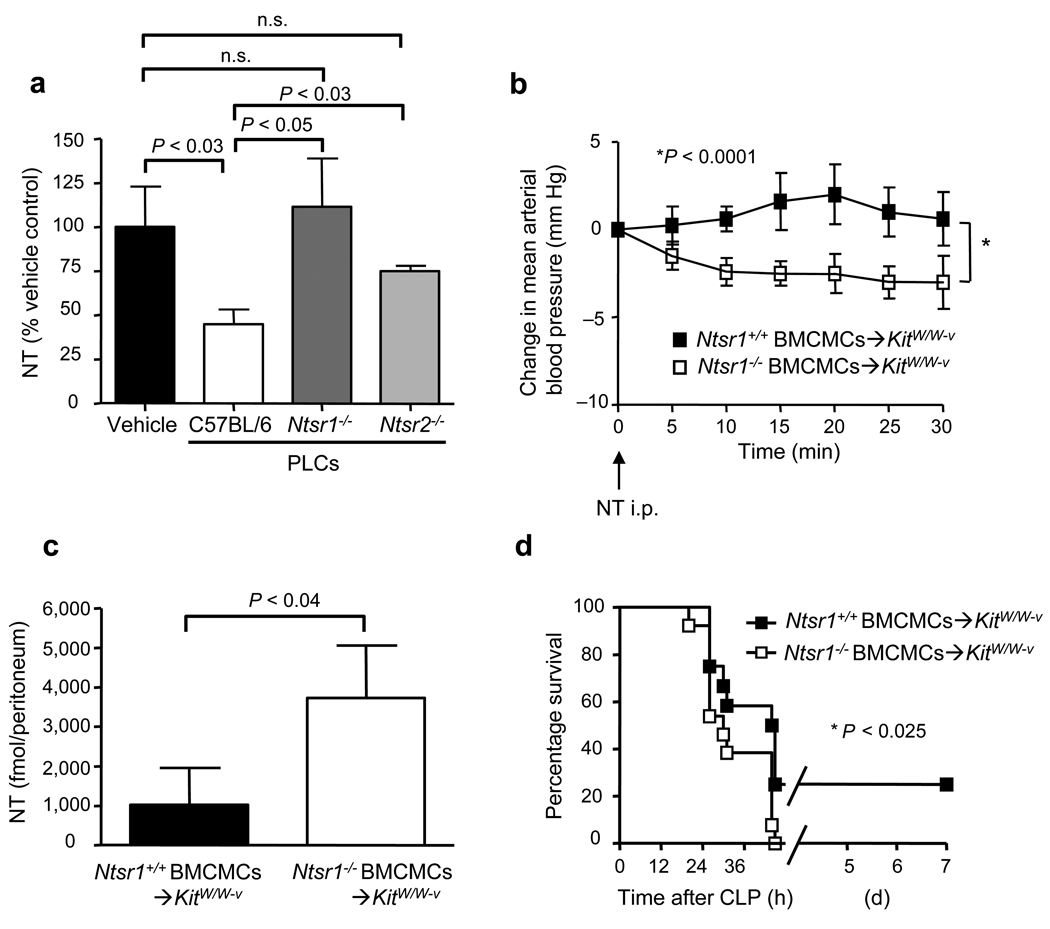
Sepsis is a complex, incompletely understood and often fatal disorder, typically accompanied by hypotension, that is considered to represent a dysregulated host response to infection. Neurotensin (NT) is a 13-amino-acid peptide that, among its multiple effects, induces hypotension. We find that intraperitoneal and plasma concentrations of NT are increased in mice after severe cecal ligation and puncture (CLP), a model of sepsis, and that mice treated with a pharmacological antagonist of NT, or NT-deficient mice, show reduced mortality during severe CLP. In mice, mast cells can degrade NT and reduce NT-induced hypotension and CLP-associated mortality, and optimal expression of these effects requires mast cell expression of neurotensin receptor 1 and neurolysin. These findings show that NT contributes to sepsis-related mortality in mice during severe CLP and that mast cells can lower NT concentrations, and suggest that mast cell-dependent reduction in NT levels contributes to the ability of mast cells to enhance survival after CLP.


Figures

Figure 1
Figure 1. NT levels are increased and contribute to mortality after CLP in mice
(a) Survival after moderate CLP (ligation of distal half of caecum; one puncture with a 22G needle) in 8–12-week old female or male wild type (Nt+/+) (n = 13) or NT-deficient (Nt−/−) (n = 12) mice. (b) Survival after severe CLP (ligation of distal half of caecum; one puncture with a 20G needle) in 8–12-week old female or male wild type (Nt+/+) (n = 28) or NT-deficient (Nt−/−) (n = 25) mice. Data in a and b were pooled from the two or five experiments performed, respectively, each of which gave similar results. (c, d) Amounts of NT in the peritoneal lavage fluid (c) and plasma concentrations of NT (d) at 24–30 h after induction of moderate or severe CLP in 8–12-week old female or male C57BL/6 wild type (Nt+/+) (n = 3–9/group).
Figure 2
Figure 2. Evidence that NT can contribute to mortality after CLP in WT or KitW/W-v MC-deficient mice
(a) Amounts of NT in the peritoneal lavage fluid at 24–28 h after moderate CLP (ligation of distal half of caecum; one puncture with a 22G needle) in wild type (Kit+/+) (n = 18), KitW/W-v mast cell [MC]-deficient (n = 15) or Kit+/+ MC-engrafted KitW/W-v (Kit+/+ BMCMCs➔KitW/W-v) (n = 6) mice. (b, c) Survival in 12-week old female KitW/W-v mast cell deficient (n = 7–8) (b) or wild type (Kit+/+) mice (n = 20) (c) after moderate CLP. (d) Survival in 12-week old female wild type (Kit+/+) mice (n = 20) after severe CLP (ligation of distal 2/3rds of caecum; one puncture with a 20G needle). In b–d, mice received two i.p. injections of SR142948A (a non-selective antagonist of Ntsr1 and Ntsr2; 100 µg/kg in 200 µl of 0.01% Tween 80 in saline [Vehicle]), or 200 µl of Vehicle, 1 h before and 8 h after CLP. Data in b–d were pooled from the three experiments performed, each of which gave similar results. (e, f) Amounts of NT in the peritoneal lavage fluid (e) and plasma concentrations of NT (f) at 24–30 h after induction of moderate CLP (ligation of the distal half of the caecum; one puncture with a 22G needle) or severe CLP (ligation of the distal 2/3 of the caecum; one puncture with a 20G needle) in 12-week old female Kit+/+ mice) (n = 3–9/group).
Figure 3
Figure 3. MCs reduce peritoneal NT concentrations and NT-induced hypotension
(a, b) Changes in mean arterial pressure (MAP) versus baseline levels (= “0”, measured 3 min after injection of 300 µl saline, i.p.) at various times after injection of NT (6 nmol in 300 µl saline, i.p.) (a) and amounts of NT in the peritoneal fluids of these mice at 30 min after injection of NT (b) in wild type (Kit+/+) (n = 5), KitW/W-v MC-deficient (n = 4) or Kit+/+ BMCMCs➔KitW/W-v (n = 6) mice.
Figure 4
Figure 4. MC-associated neurolysin (NLN) contributes to the ability of MCs to reduce NT levels and NT-induced hypotension
(a) Identification of NLN in membrane and cytosol fractions of C1.MC/C57.1 MCs and C57BL/6J BMCMCs. (b) Degradation of NT (10 µM) by membrane or cytosol preparations from Kit+/+ BMCMCs (2 × 10⁶ cells/preparation) that were pre-treated with either vehicle (“−”) or with Pro-Ile (10 µM, 15 min at 37 °C). Results are expressed as the percentage of NT remaining after incubation with membrane or cytosol preparations as compared to samples of NT incubated in vehicle alone (n = 6/group, data were pooled from two independent experiments that gave similar results). (c, d) Degradation of NT (10 µM) by A23187 (5 µM)-activated Kit+/+ BMCMCs (2 × 10⁵) that were pre-treated with either empty vector, NLN-shRNA or mMC-CPA-shRNA. Cells were incubated with NT for 30 min at 37 °C. Results are expressed as the percentage of NT remaining in the samples compared to that in samples of NT incubated in vehicle alone at 37 °C (n = 9/group, data were pooled from three independent experiments that gave similar results). (e) Changes in MAP versus baseline levels (= “0”, measured 3 min after injection of 300 µl saline, i.p.) at various times after injection of NT (6 nmol in 300 µl saline, i.p.) in KitW/W-v mice which had been engrafted i.p. with Kit+/+ BMCMCs treated with either empty vector (empty vector BMCMCs➔KitW/W-v), NLN-shRNA (NLN-shRNA BMCMCs➔KitW/W-v) or mMC-CPA-shRNA (mMC-CPA-shRNA BMCMCs➔KitW/W-v) (n = 4/group).
Figure 5
Figure 5. MCs can degrade NT in the absence of extensive degranulation
(a) Percentage of PMCs obtained from Kit+/+ mice exhibiting > 50% (“Extensive”), 10–50% (“Moderate”) or < 10% (“None”) degranulation at 30 min after injection of NT (6 nmol/300 µl saline), ET-1 (1.2 nmol/300 µl saline) or saline. *** P < 0.0001 for comparisons shown by brackets. Photomicrographs are of May Grunwald-modified Giemsa-stained PLC preparations illustrating PMCs that exhibit no (left), moderate (middle) or extensive (right) degranulation (scale bars = 10 mm). (b) PLCs containing 1 × 10⁴ PMCs obtained from C57BL/6 mice were incubated for 2 h with 3H-serotonin and stimulated for 15 min at 37 °C with either ET-1 (4 µM), NT (10 µM), or vehicle. In a separate set of experiments, cells were pre-incubated with BAPTA-AM (50 mM, 15 min, 37 °C) before the addition of the stimuli (n = 6/group). (c) mMC-CPA activity was measured in supernatants obtained from Kit+/+ PLCs containing 5 × 10⁴ PMCs that were stimulated for 30 min at 37 °C with either ET-1 (4 µM), NT (10 µM), or vehicle (n = 3–4/group). (d) PLCs containing 5 × 10⁴ PMCs from C57BL/6J mice were pre-treated for 15 min with BAPTA-AM (50 mM) and then incubated with NT (10 µM) for 30 min at 37 °C. Results are expressed as the percentage NT remaining after incubation with cells compared to that in samples of NT incubated in vehicle alone at 37 °C (n = 4/group). Data in b–d were pooled from the two independent experiments performed in each case, each of which gave similar results.
Figure 6
Figure 6. MC expression of Ntsr1 is required for optimal MC-dependent reduction of NT-induced hypotension and enhancement of survival after CLP
(a) PLCs containing 5 × 10⁴ PMCs from C57BL/6, Ntsr1−/− or Ntsr2−/− mice were incubated with NT (10 µM) for 30 min at 37 °C. Results are expressed as the percentage of NT remaining after incubation with cells compared to that in samples of NT incubated in vehicle alone at 37 °C (data were pooled from triplicate determinations in the two independent experiments performed, each of which gave similar results). (b, c) Changes in MAP vs. baseline levels (= “0”, measured 3 min after injection of 300 µl saline, i.p.) at various times after injection of NT (6 nmol in 300 µl saline, i.p.) (b), and amounts of NT in the peritoneal fluids of these mice at 30 min after NT injection (c), in KitW/W-v mice that had been engrafted i.p. with BMCMCs of C57BL/6-Ntsr1+/+ (n = 7) or -Ntsr1−/− (n = 6) origin. (d) Survival after moderate CLP (ligation of distal half of caecum; one puncture with a 22G needle) in KitW/W-v mice that had been engrafted i.p. with BMCMCs of C57BL/6-Ntsr1+/+ (n = 14) or -Ntsr1−/− (n = 13) origin.

References

    1. Angus DC, Wax RS. Epidemiology of sepsis: an update. Crit Care Med. 2001;29:S109–S116. - PubMed
    1. Grocott-Mason RM, Shah AM. Cardiac dysfunction in sepsis: new theories and clinical implications. Intensive Care Med. 1998;24:286–295. - PubMed
    1. Cohen J. The immunopathogenesis of sepsis. Nature. 2002;420:885–891. - PubMed
    1. Martin GS, Mannino DM, Eaton S, Moss M. The epidemiology of sepsis in the United States from 1979 through 2000. N Engl J Med. 2003;348:1546–1554. - PubMed
    1. Riedemann NC, Guo RF, Ward PA. The enigma of sepsis. J Clin Invest. 2003;112:460–467. - PMC - PubMed

Publication types

MeSH terms