. 2008 Mar 31:9:148.
doi: 10.1186/1471-2164-9-148.

The unique genomic properties of sex-biased genes: insights from avian microarray data

Affiliations

The unique genomic properties of sex-biased genes: insights from avian microarray data

Judith E Mank et al. BMC Genomics. .

Abstract

Background: In order to develop a framework for the analysis of sex-biased genes, we present a characterization of microarray data comparing male and female gene expression in 18 day chicken embryos for brain, gonad, and heart tissue.

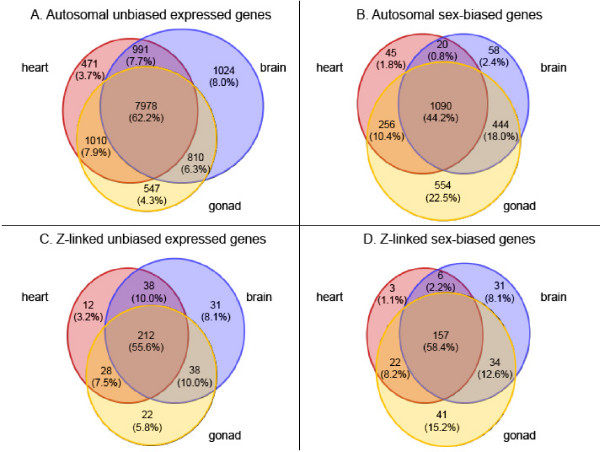
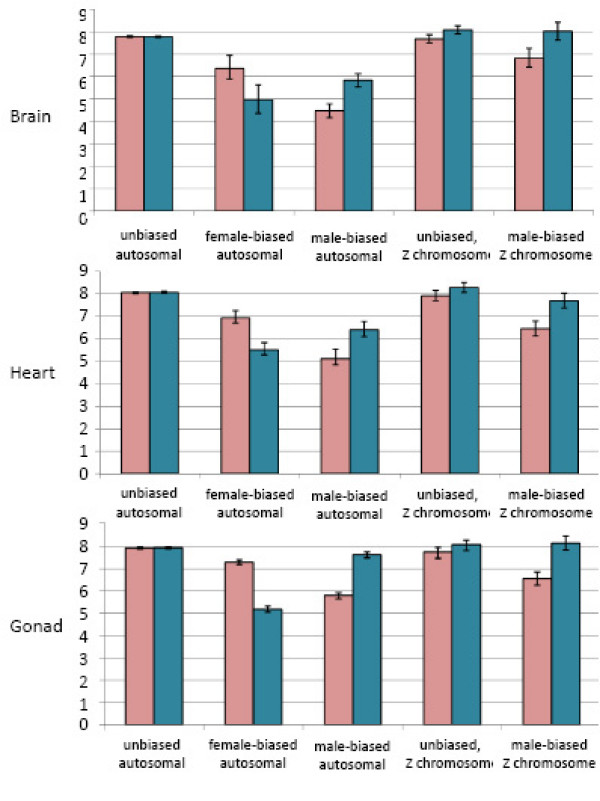
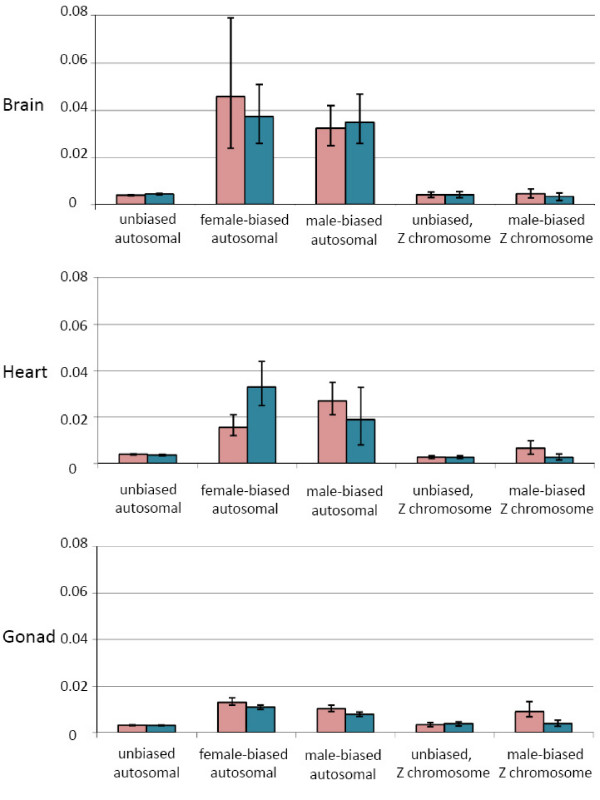
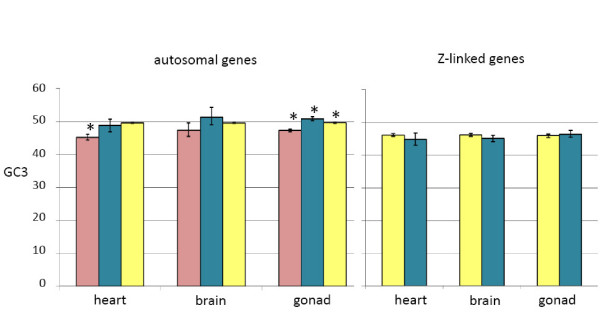
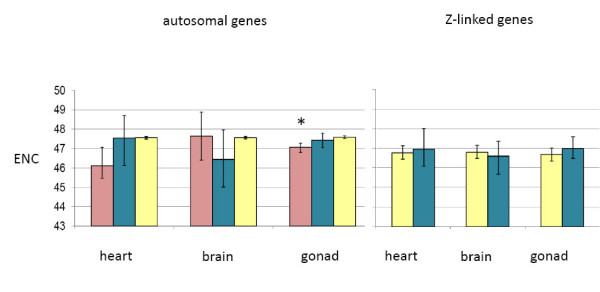
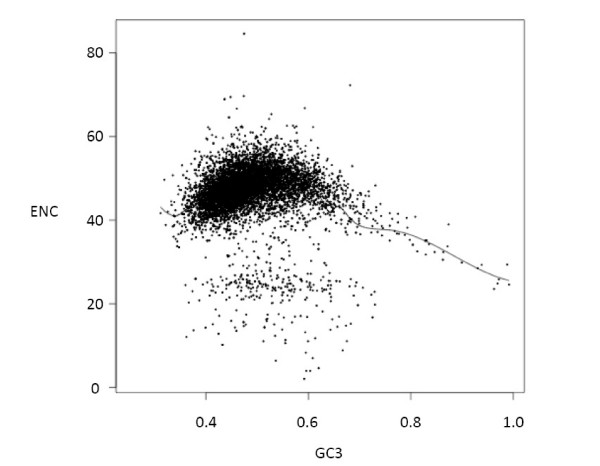
Results: From the 15982 significantly expressed coding regions that have been assigned to either the autosomes or the Z chromosome (12979 in brain, 13301 in gonad, and 12372 in heart), roughly 18% were significantly sex-biased in any one tissue, though only 4 gene targets were biased in all tissues. The gonad was the most sex-biased tissue, followed by the brain. Sex-biased autosomal genes tended to be expressed at lower levels and in fewer tissues than unbiased gene targets, and autosomal somatic sex-biased genes had more expression noise than similar unbiased genes. Sex-biased genes linked to the Z-chromosome showed reduced expression in females, but not in males, when compared to unbiased Z-linked genes, and sex-biased Z-linked genes were also expressed in fewer tissues than unbiased Z coding regions. Third position GC content, and codon usage bias showed some sex-biased effects, primarily for autosomal genes expressed in the gonad. Finally, there were several over-represented Gene Ontology terms in the sex-biased gene sets.

Conclusion: On the whole, this analysis suggests that sex-biased genes have unique genomic and organismal properties that delineate them from genes that are expressed equally in males and females.


Figures

Figure 1
Figure 1
Venn diagram showing tissue specificity for unbiased and sex-biased genes for brain (blue), heart (red) and gonad (yellow). Panel A. Expression intersection of autosomal unbiased genes. Panel B. Expression intersection of autosomal sex-biased genes. Panel C. Expression intersection of Z-linked unbiased genes. Panel D. Expression intersection of Z-linked sex-biased genes. Sex-biased genes identified as significantly differentially expressed (padj < 0.05, absolute log2 fold-change > 1) in at least one tissue analyzed.
Figure 2
Figure 2
Average relative expression for unbiased, female-biased, and male-biased gene sets for the three tissues analyzed. Sex-biased was determined for each tissue separately, and genes that were differentially expressed between males and females (padj < 0.05) with an absolute log2 fold-change > 1 were classed as sex-biased. Pink bars represent the average across female replicates, blue bars represent the average across male replicates. 95% confidence whiskers are shown, based on bootstrapping (1000 repetitions). Due to small sample sizes, the female-biased Z-linked category is not shown. See Table 1 for numbers of genes in each expression class. The Y-axis corresponds to relative expression levels.
Figure 3
Figure 3
Average within-sex gene expression variance for sex-biased expression categories. Sex-biased was determined for each tissue separately, and genes that were differentially expressed between males and females (padj < 0.05) with a absolute log2 fold-change > 1 were classed as sex-biased. Pink bars represent the average across female replicates, blue bars represent the average across male replicates. The Y-axis represents expression variance values. 95% confidence whiskers are shown, based on bootstrapping (1000 repetitions). Due to small sample sizes, the female-biased Z-linked category is not shown. See Table 1 for numbers of genes in each expression class.
Figure 4
Figure 4
Average third position GC (GC3) content for expression categories. Sex-biased expression was determined with absolute log2 fold-change > 1 cutoff (padj < 0.05). 95% confidence intervals (based on bootstrapping, 1000 repetitions) are shown. Sex-biased categories that differed significantly from unbiased genes in the same tissue are indicated (*, p < 0.05, see materials and methods for statistical metrics). Pink bars represent female GC3 values, blue bars represent male values, and yellow bars represent unbiased values. The Y-axis represents the proportion of coding sequence composed of G or C.
Figure 5
Figure 5
Average effective number of codons (ENC) for expression categories. Sex-biased expression was determined with absolute log2 fold-change > 1 cutoff (padj < 0.05). 95% confidence intervals (based on bootstrapping, 1000 repetitions) are shown. Sex-biased categories that differed significantly from unbiased genes in the same tissue are indicated (*, p < 0.05, see materials and methods for statistical metrics). Pink bars represent female GC3 values, blue bars represent male values, and yellow bars represent unbiased values. ENC can theoretically range from 20 (extreme bias) to 61 (where all alternate codons are equally likely).
Figure 6
Figure 6
Relationship between GC3 and codon usage bias (ENC) in significantly expressed genes. A smoothed spline has been fitted to the data and is shown.

Similar articles

Cited by

References

    1. Ellegren H, Parsch J. The evolution of sex-biased genes and sex-biased gene expression. Nature Reviews Genetics. 2007;8:689–698. doi: 10.1038/nrg2167. - DOI - PubMed
    1. Eads BD, Colbourne JK, Bohuski E, Andrews J. Profiling sex-biased gene expression during parthenogenetic reproduction in Daphnia pulex. BMC Genomics. 2007. - PMC - PubMed
    1. Marinotti O, Calvo E, Nguyen QK, Dissanayake S, Ribeiro JMC, James AA. Genome-wide analysis of gene expression in adult Anopheles gambiae. Insect Molecular Biology. 2006;15:1–12. doi: 10.1111/j.1365-2583.2006.00610.x. - DOI - PubMed
    1. Ranz JM, Castillo-Davis CI, Meiklejohn CD, Hartl DL. Sex-dependent gene expression and evolution of the Drosophila transcriptome. Science. 2003;300:1742–1745. doi: 10.1126/science.1085881. - DOI - PubMed
    1. Yang X, Schadt EE, Wang S, Wang H, Arnold AP, Ingram-Drake L, Drake TA, Lusis AJ. Tissue-specific expression and regulation of sexually dimorphic genes in mice. Genome Research. 2006;16:995–1004. doi: 10.1101/gr.5217506. - DOI - PMC - PubMed

Publication types