. 2008 Jun;28(11):3672-85.
doi: 10.1128/MCB.00510-07. Epub 2008 Mar 31.

In vivo study of the nucleosome assembly functions of ASF1 histone chaperones in human cells

Affiliations

In vivo study of the nucleosome assembly functions of ASF1 histone chaperones in human cells

Angélique Galvani et al. Mol Cell Biol. 2008 Jun.

Abstract

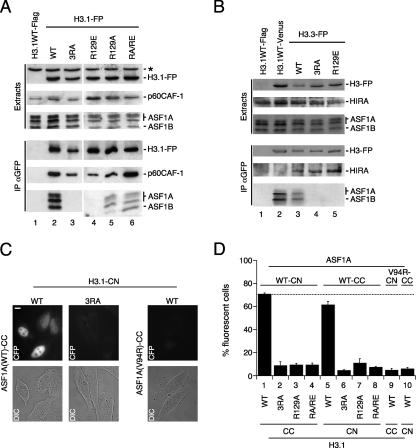
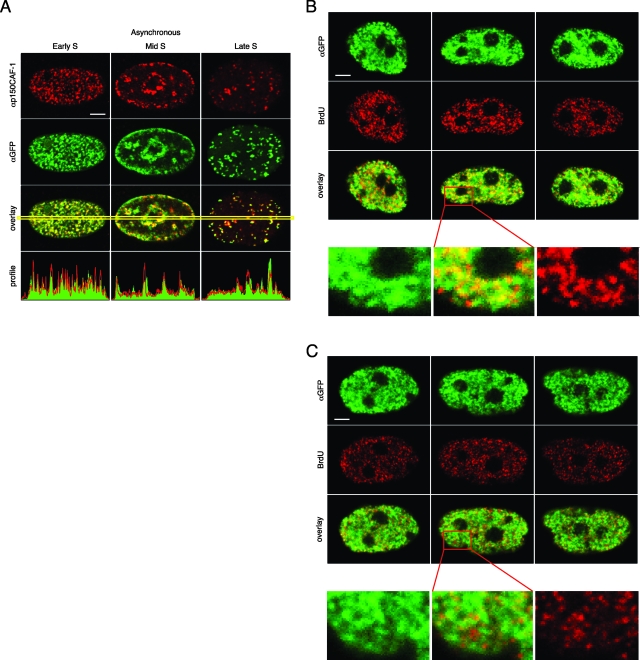
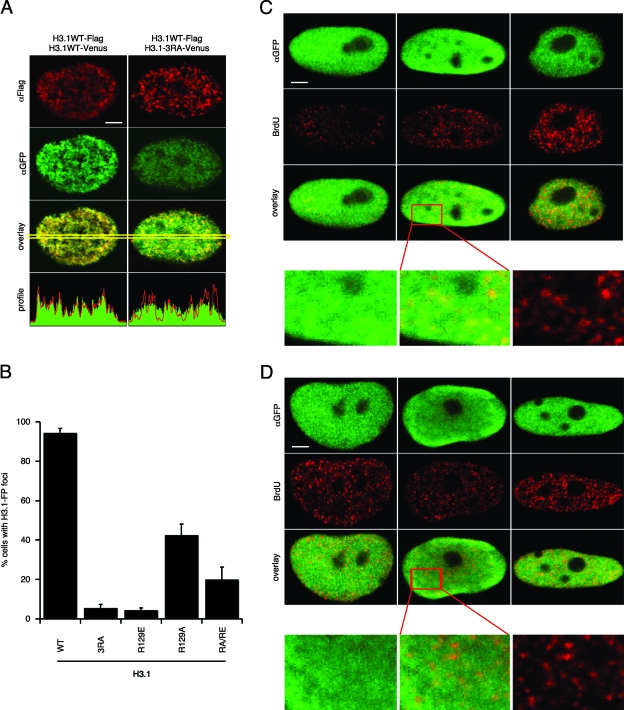
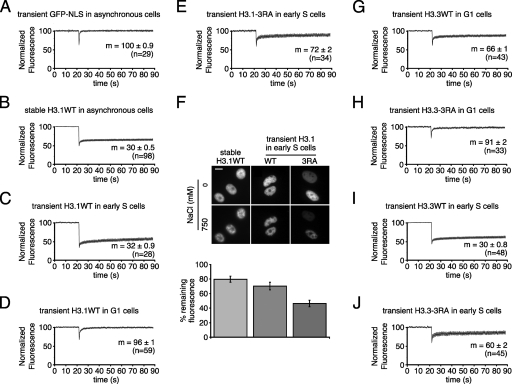
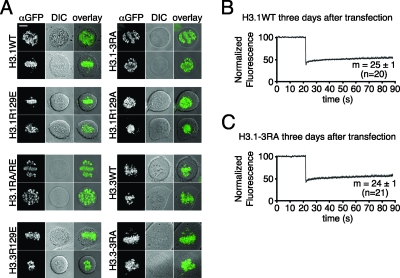
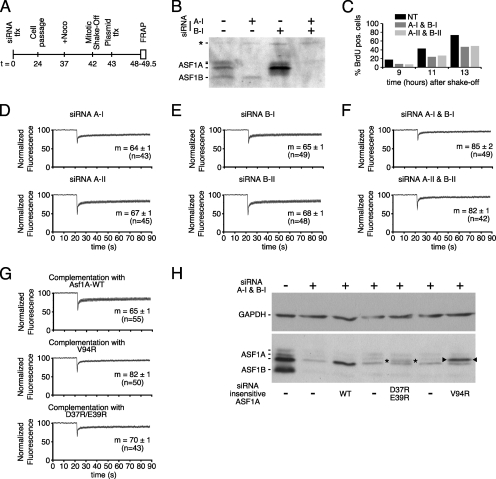
Histone chaperones have been implicated in nucleosome assembly and disassembly as well as histone modification. ASF1 is a highly conserved histone H3/H4 chaperone that synergizes in vitro with two other histone chaperones, chromatin assembly factor 1 (CAF-1) and histone repression A factor (HIRA), in DNA synthesis-coupled and DNA synthesis-independent nucleosome assembly. Here, we identify mutants of histones H3.1 and H3.3 that are unable to interact with human ASF1A and ASF1B isoforms but that are still competent to bind CAF-1 and HIRA, respectively. We show that these mutant histones are inefficiently deposited into chromatin in vivo. Furthermore, we found that both ASF1A and ASF1B participate in the DNA synthesis-independent deposition of H3.3 in HeLa cells, thus highlighting an unexpected role for ASF1B in this pathway. This pathway does not require interaction of ASF1 with HIRA. We provide the first direct determination that ASF1A and ASF1B play a role in the efficiency of nucleosome assembly in vivo in human cells.


Figures

FIG. 1.
FIG. 1.
Interaction of histone chaperones with wild-type (WT) and mutant H3 histones. (A and B) GFP fusion proteins were immunoprecipitated with anti-GFP antibodies (αGFP) 24 h after transfection of HeLa cells with the indicated constructs. Western blotting with anti-GFP, anti-p60CAF-1, anti-HIRA, or anti-hASF1 antibodies was carried out to assess the presence of these proteins before (Extracts) and after immunoprecipitation (IP αGFP). (A) Coimmunoprecipitation of p60CAF-1 and hASF1 with H3.1. Lane 1, H3.1WT-Flag; lane 2, H3.1WT-Venus; lane 3, H3.1-3RA-Venus; lane 4, H3.1R129E-CFP; lane 5, H3.1R129A-CFP; lane 6, H3.1RA/RE-CFP. The position of a nonspecific band revealed with anti-GFP antibodies is indicated by an asterisk to the right of the gel. Note that three bands corresponding to diversely phosphorylated ASF1A can be seen, as previously reported (50). Note also that there is no coimmunoprecipitation of hASF1 with H3.1-3RA and H3.1R129E, whereas coimmunoprecipitation of p60CAF-1 is retained. (B) Coimmunoprecipitation of HIRA and hASF1 with H3.3. Lane 1, H3.1WT-Flag; lane 2, H3.1WT-Venus; lane 3, H3.3WT-Venus; lane 4, H3.3-3RA-Venus; lane 5, H3.1R129E-CFP. Note that there is no coimmunoprecipitation of hASF1 with H3.3-3RA and H3.3R129E, whereas coimmunoprecipitation of HIRA is retained. (C) BiFC with ASF1A and H3.1. CFP autofluorescence images of HeLa cells transiently expressing H3.1 (WT or 3RA mutant) fused to residues 1 to 172 of CFP (CN) and ASF1A (WT or V94R mutant) fused to residues 155 to 238 of CFP (CC) 24 h after transfection (CFP fluorescence [CFP] or differential interference contrast [DIC]). The maximum and minimum levels of CFP fluorescence were adjusted to the same values for each of the images. Note the difference between cells with reconstituted CFP fluorescence in the nucleus (top left panel) and the faint cytoplasmic autofluorescence of cells transfected with either H3.1WT/ASF1A-V94R (top right panel) or H3.1-3RA/ASF1A-WT (top middle panel). Bar = 10 μm. (D) Quantification of BiFC efficiency for H3.1 mutants versus ASF1A. The percentage of cells exhibiting CFP fluorescence as exemplified in Fig. 1C was estimated in two separate experiments with all protein couples indicated under the histogram: n = 211 (bar 1), n = 210 (bar 2), n = 196 (bar 3), n = 224 (bar 4), n = 232 (bar 5), n = 231 (bar 6), n = 201 (bar 7), n = 250 (bar 8), n = 196 (bar 9), and n = 177 (bar 10). The mean values plus standard deviations (error bars) are shown. The average transfection efficiency in these experiments was estimated with an H3.1-CFP reporter construct and is represented here as a dotted line.
FIG. 2.
FIG. 2.
Localization of newly synthesized wild-type H3.1 in S-phase cells. (A) Newly synthesized H3.1 is localized in replication foci in S-phase cells. Replication foci were revealed with anti-p150CAF-1 antibodies (αp150CAF-1) (red) in asynchronous HeLa cells. Transiently transfected H3.1-Venus was revealed with anti-GFP antibodies (αGFP) (green). The extent of colocalization can be estimated from the “overlay” panels and from the “profile” curves, which correspond to the intensity profiles in red and green along a line inside the yellow frame shown on the “overlay” panels. (B and C) Replication foci were revealed with anti-BrdU antibodies (red) in synchronized HeLa cells transiently transfected with H3.1WT-Venus, revealed with anti-GFP antibodies (green). Three typical nuclei are shown. The unlabeled bottom row of panels was taken with 3.6× zoom, corresponding to the red box on the overlap image. Cells were fixed 1 h (B) or 2 h (C) after release from the thymidine block. Bar = 5 μm.
FIG. 3.
FIG. 3.
Localization of newly synthesized mutant H3.1 in S-phase cells. (A) Localization of H3.1-3RA versus H3.1WT in synchronized S-phase cells. Replication foci were revealed with anti-Flag antibodies (αFlag) (red) in synchronized HeLa cells transiently transfected with H3.1WT-Flag, 1.5 h after release from a thymidine block. Cotransfected H3.1-Venus was revealed with anti-GFP antibodies (αGFP) (green). Note the colocalization between H3.1WT-Flag and H3.1WT-Venus in the panels on the left. Note the diffuse nuclear localization of H3.1-3RA-Venus and the diminished colocalization with H3.1WT in the panels on the right. Bar = 5 μm. (B) Quantification of the localization defects of H3.1 mutants. The histogram shows the percentage of cells in which the foci of H3.1-Venus (wild type [WT] or mutant as indicated) were clearly visible and colocalized with H3.1WT-Flag foci; the foci were observed by using anti-Flag and anti-GFP antibodies on synchronized S-phase HeLa cells transfected with H3.1WT-Flag and H3.1-Venus (WT or mutant). The presence of foci was assessed in at least five independent experiments on 642 (WT), 646 (3RA), 526 (R129E), 514 (R129A), and 672 (RA/RE) cells. The mean values plus standard deviations (error bars) are shown. (C and D) Replication foci were revealed with anti-BrdU antibodies (red) in synchronized HeLa cells transiently transfected with H3.1-3RA-Venus or revealed with anti-GFP antibodies (green). The unlabeled bottom row of panels was taken with 3.6× zoom, corresponding to the red box on the overlap image. Three typical nuclei are shown. Cells were fixed 1 h (C) or 2 h (D) after release from the thymidine block. Bar = 5 μm.
FIG. 4.
FIG. 4.
Deposition of newly synthesized histone H3.1 and H3.3 in chromatin during S and G1 phases. (A to E and G to J) Normalized fluorescence (arbitrary units) recovered after photobleaching in HeLa cells. The curve (black) represents the mean of n distinct acquisitions after normalization. The vertical bars along the curves represent the 99% confidence interval. The average values (m) correspond to the mean of the last 15 fluorescence values for all n acquisitions (±99% confidence interval [see Materials and Methods for calculation method]). (A) Asynchronous cells expressing the GFP nuclear localization signal (GFP-NLS). GFP-NLS was exclusively nuclear. (B) Asynchronous cells stably expressing H3.1WT-GFP. (C) Synchronized S-phase cells transiently expressing H3.1WT-Venus. (D) Synchronized G1-phase cells transiently expressing H3.1WT-Venus. (E) Synchronized S-phase cells transiently expressing H3.1-3RA-Venus. (G) Synchronized G1-phase cells transiently expressing H3.3WT-Venus. (H) Synchronized G1-phase cells transiently expressing H3.3-3RA-Venus. (I) Synchronized S-phase cells transiently expressing H3.3WT-Venus. (J) Synchronized S-phase cells transiently expressing H3.3-3RA-Venus. As expected, there is a correlation between the extent of photobleaching and the fraction of rapidly diffusing, mobile protein (41). (F) Percentage of fluorescence intensity remaining in the nuclei after salt extraction. Cells stably expressing H3.1WT-GFP were asynchronous. Transiently transfected HeLa cells were synchronized in early S phase (1 to 2 h after release from thymidine block). The cells were treated successively with 0 mM and 750 mM NaCl. (Top) Nuclei before (0 mM NaCl) and after (750 mM NaCl) salt extraction. Not all nuclei retained their shape after extraction (not shown). Bar = 10 μm. (Bottom) Quantification of the remaining fluorescence after salt extraction, expressed as a percentage of fluorescence in 0 mM NaCl (with 99% confidence interval). The data shown correspond to two independent extractions on 68 cells (stably expressing H3.1WT), 63 cells (transiently expressing H3.1WT), and 58 cells (transiently expressing H3.1-3RA).
FIG. 5.
FIG. 5.
Mutant H3 histones unable to bind hASF1 end up in chromatin. (A) HeLa cells were transfected with the indicated constructs (H3.1WT-Venus, H3.1-3RA-Venus, H3.1R129E-CFP, H3.1R129A-CFP, H3.1RA/RE-Venus, H3.3WT-Venus, H3.3R129E-CFP, and H3.3-3RA-Venus). Three days after transfection, the cells were treated with nocodazole for 5 h in order to enrich the population in mitotic cells and then treated for immunofluorescence with anti-GFP antibodies (αGFP). DIC, differential interference contrast. Note that H3-FP is detected only on the chromosomes for all the constructs. Note also that atypical mitotic figures are due to the nocodazole treatment. Bar = 10 μm. (B and C) Normalized fluorescence (arbitrary units) recovered after photobleaching in HeLa cells 3 days after transfection. The curve (black) represents the mean of n distinct acquisitions after normalization. The vertical bars along the curves represent the 99% confidence interval. The average values (m) correspond to the mean of the last 15 fluorescence values for all n acquisitions (±99% confidence interval). (B) H3.1WT-Venus; (C) H3.1-3RA-Venus.
FIG. 6.
FIG. 6.
Chromatin deposition of wild-type H3.3 in hASF1-depleted cells and complementation by wild-type and mutant ASF1A. (A) Experimental time line for HeLa cell transfection (tfx) with siRNA, synchronization, transfection with plasmids, and FRAP analysis. +Noco, treated with nocodazole. (B) Anti-hASF1 Western blot showing the extent of hASF1 knockdown by siRNA (as indicated) in extracts of cells harvested after FRAP experiments. The position of a nonspecific band revealed with anti-hASF1 antibodies is indicated by an asterisk to the left of the gel. (C) Measure of the length of G1 phase in undepleted (not treated with siRNA [NT]) and hASF1-depleted synchronized cells. BrdU was added immediately after release from the mitotic block (shake-off). BrdU-positive (pos.) cells were counted after shake-off on 696, 813, and 503 cells (undepleted or not treated [NT]), 1,017, 748, and 757 cells (depleted with A-I and B-I), 669, 835, and 663 cells (depleted with A-II and B-II) after 9, 11, and 13 h, respectively. (D to G) Normalized fluorescence (arbitrary units) recovered after photobleaching in HeLa cells. The black curves represent the mean of n distinct acquisitions after normalization. The vertical bars along the curve represent the 99% confidence interval. The average values (m) correspond to the mean of the last 15 fluorescence values for all n acquisitions (±99% confidence interval). (D) HeLa cells treated with siRNA A-I or A-II. (E) HeLa cells treated with siRNA B-I or B-II. (F) HeLa cells treated with siRNA A-I and B-I or A-II and B-II. (G) HeLa cells treated with siRNA A-I and B-I and transfected with siRNA-insensitive ASF1A-WT (top panel), ASF1A-V94R (middle panel), or ASF1A-D37R+E39R (bottom panel). (H) Western blotting of hASF1-depleted HeLa cells with (+) or without (−) expression of siRNA-insensitive wild-type (WT) and mutant ASF1A as indicated. Extracts from cells treated identically to the cells in panel G, but not subjected to FRAP. The positions of ASF1A-D37R+E39R (asterisks) and ASF1A-V94R (▸) are indicated on the gels. An anti-glyceraldehyde-3-phosphate dehydrogenase (anti-GAPDH) Western blot on the same membrane is shown as a loading control.

Similar articles

Cited by

References

    1. Adkins, M. W., and J. K. Tyler. 2004. The histone chaperone Asf1p mediates global chromatin disassembly in vivo. J. Biol. Chem. 27952069-52074. - PubMed
    1. Agez, M., J. Chen, R. Guerois, C. van Heijenoort, J. Y. Thuret, C. Mann, and F. Ochsenbein. 2007. Structure of the histone chaperone ASF1 bound to the histone H3 C-terminal helix and functional insights. Structure 15191-199. - PubMed
    1. Ahmad, K., and S. Henikoff. 2002. The histone variant H3.3 marks active chromatin by replication-independent nucleosome assembly. Mol. Cell 91191-1200. - PubMed
    1. Antczak, A. J., T. Tsubota, P. D. Kaufman, and J. M. Berger. 2006. Structure of the yeast histone H3-ASF1 interaction: implications for chaperone mechanism, species-specific interactions, and epigenetics. BMC Struct. Biol. 626. - PMC - PubMed
    1. Bravo, R., and H. Macdonald-Bravo. 1987. Existence of two populations of cyclin/proliferating cell nuclear antigen during the cell cycle: association with DNA replication sites. J. Cell Biol. 1051549-1554. - PMC - PubMed

Publication types