. 2008 Apr 7;181(1):65-78.
doi: 10.1083/jcb.200712027. Epub 2008 Mar 31.

Plk1- and beta-TrCP-dependent degradation of Bora controls mitotic progression

Affiliations

Plk1- and beta-TrCP-dependent degradation of Bora controls mitotic progression

Akiko Seki et al. J Cell Biol. .

Abstract

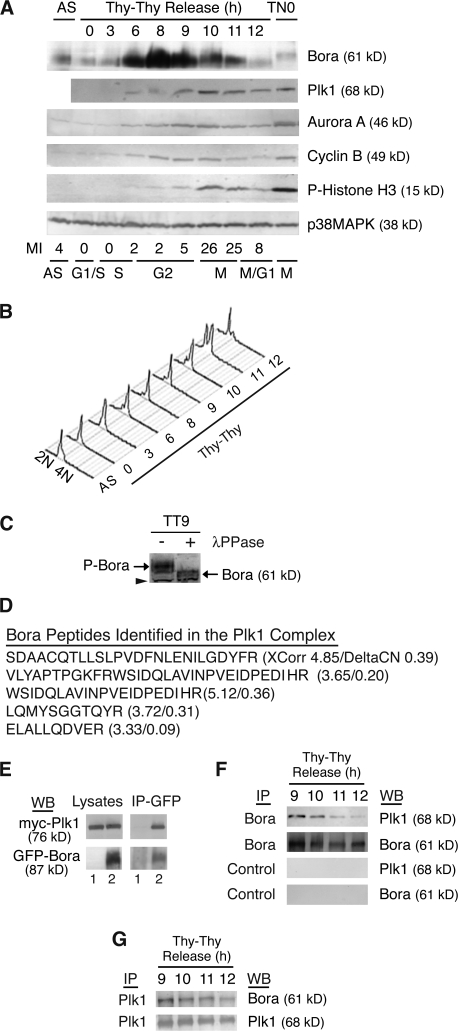
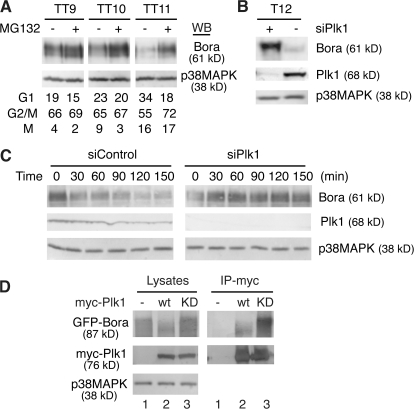
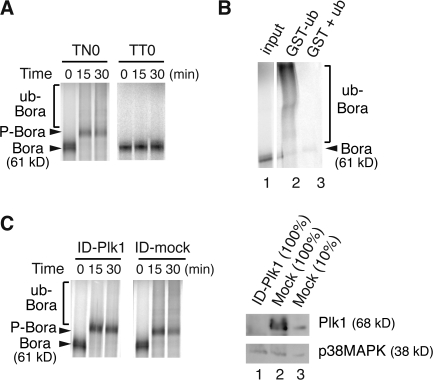
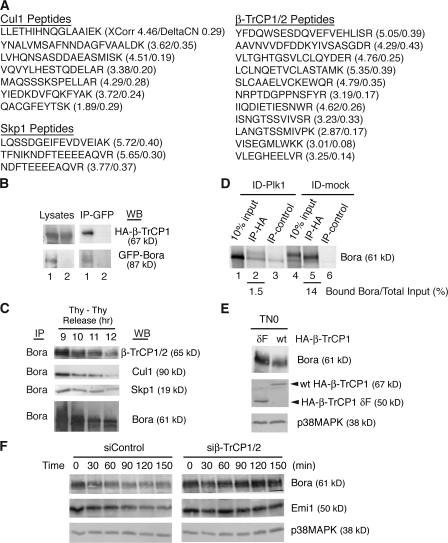
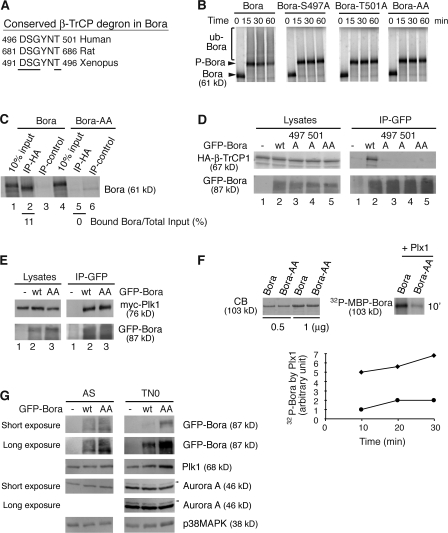
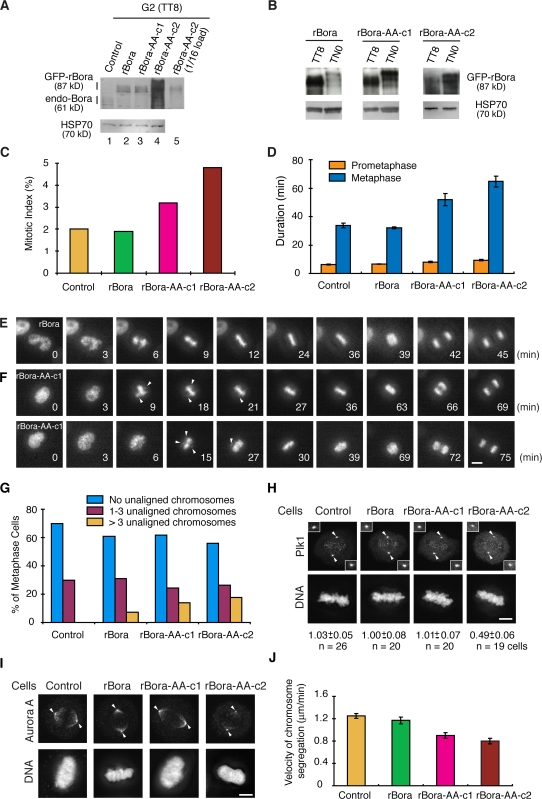
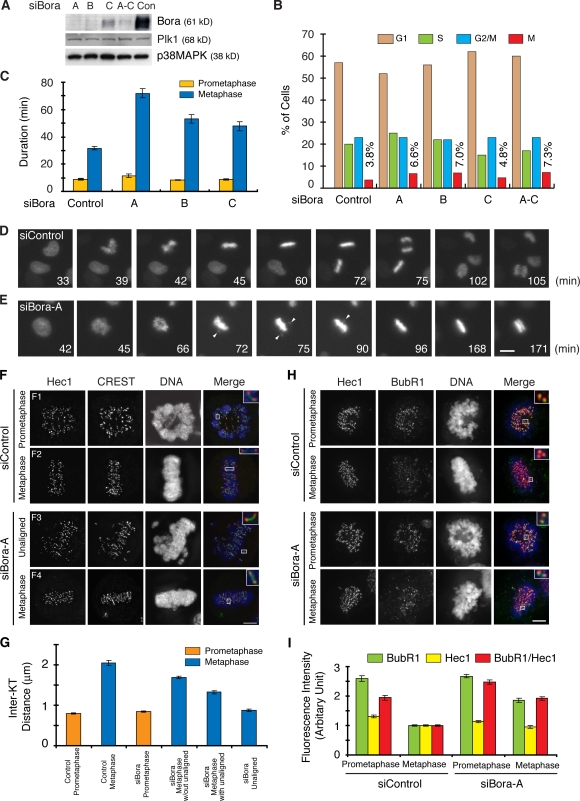
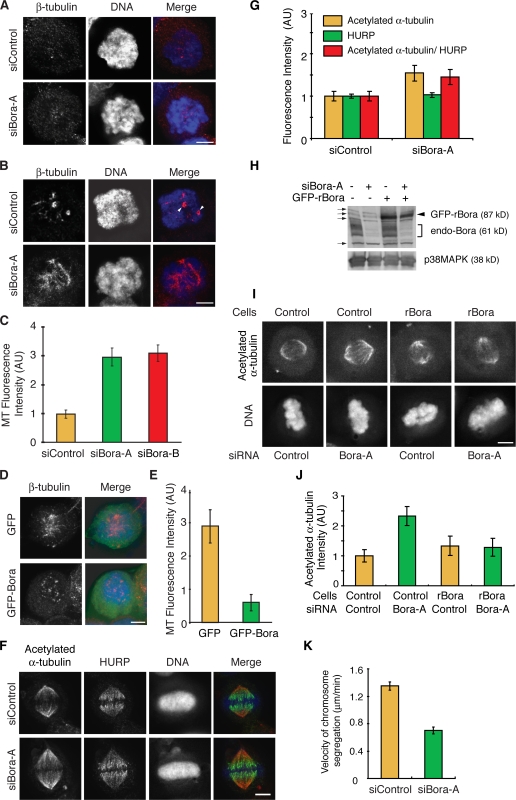
Through a convergence of functional genomic and proteomic studies, we identify Bora as a previously unknown cell cycle protein that interacts with the Plk1 kinase and the SCF-beta-TrCP ubiquitin ligase. We show that the Bora protein peaks in G2 and is degraded by proteasomes in mitosis. Proteolysis of Bora requires the Plk1 kinase activity and is mediated by SCF-beta-TrCP. Plk1 phosphorylates a conserved DSGxxT degron in Bora and promotes its interaction with beta-TrCP. Mutations in this degron stabilize Bora. Expression of a nondegradable Bora variant prolongs the metaphase and delays anaphase onset, indicating a physiological requirement of Bora degradation. Interestingly, the activity of Bora is also required for normal mitotic progression, as knockdown of Bora activates the spindle checkpoint and delays sister chromatid segregation. Mechanistically, Bora regulates spindle stability and microtubule polymerization and promotes tension across sister kinetochores during mitosis. We conclude that tight regulation of the Bora protein by its synthesis and degradation is critical for cell cycle progression.


Figures

Figure 1.
Figure 1.
Bora is a cell cycle protein interacting with Plk1. (A and B) The levels of Bora fluctuate in the cell cycle. HeLa S3 cells were synchronized at the G1/S boundary by a double thymidine arrest (Thy–Thy), released into fresh media, and harvested at the indicated times. Protein levels were analyzed by Western blotting (A) and cell cycle profile was assayed by FACS with a propidium iodine staining and with an anti-MPM2 antibody staining (A and B). The MPM2 antibody recognizes mitotic phosphoproteins and was used here to determine mitotic index. p38MAPK served as a loading control. AS, unsynchronized cells; TN0, prometaphase cells synchronized by a thymidine-nocodazole arrest. (C) Phosphorylation of Bora in the cell cycle. G2 cells were collected at 9 h (TT9) after release from a double thymidine arrest and cell lysates were incubated with or without λ-phosphatase (λ-PPase). In a Western blot analysis, the phosphorylation state of Bora was determined by its mobility in SDS-PAGE. Arrowhead points to a cross reacting band, which also serves as a loading control. P-Bora, phospho-Bora. (D) Identification of Bora as a Plk1-interacting protein. Listed are peptides of Bora identified by mass spectrometry in the GFP-S-Plk1 complexes together with their XCorr and DeltaCN scores. (E) Ectopically expressed Bora interacts with Plk1. Myc-Plk1 was cotransfected with GFP (lane 1) or GFP-Bora (Lane 2) into HeLa cells and cells were harvested at 48 h after transfection. Cell lysates and the anti-GFP immunoprecipitates (IP) were assayed by Western blotting (WB). (F and G) Endogenous Bora interacts with Plk1 during Bora degradation. HeLa S3 cells were synchronized as in A. Endogenous Bora (F) or Plk1 (G) was immunoprecipitated with respective antibodies and associated proteins were analyzed by Western blotting. Control IP in F corresponded to immunoprecipitation with nonspecific IgG.
Figure 2.
Figure 2.
Bora is degraded in a Plk1- and proteasome-dependent manner. (A) Proteasome-dependent degradation of Bora. HeLa S3 cells were synchronized with a double thymidine arrest and then released into fresh media. At 7, 8, and 9 h after release, the proteasome inhibitor MG132 or control DMSO was added and cells were collected 2 h later (TT9, 10, and 11, respectively). Protein levels were analyzed by Western blotting and cell cycle profile was determined by FACS. (B) Plk1 controls the Bora protein level. HeLa cells were transfected with a siRNA targeted to Plk1 (siPlk1) or a control siRNA, synchronized with thymidine for 18 h, and then released. At 10 h after release, 1 μM taxol was added and mitotic cells harvested 2 h later (T12). Protein levels were determined by Western blotting. (C) Plk1 controls Bora half-life. HeLa cells were synchronized by a double thymidine treatment and transfected with a control siRNA (siControl) or siPlk1 during the second thymidine arrest. At 8 h after release from the second thymidine arrest, 100 μg/ml cyclohexamine was added and cells were harvested at 0, 30, 60, 90, 120, and 150 min later. Half-life of Bora was determined by Western blotting. (D) Plk1 kinase activity is required for Bora degradation. GFP-Bora was cotransfected with a control vector (lane 1), myc-Plk1 (lane 2), or myc-Plk1-K82R (lane 3; KD, kinase dead) and cells were harvested at 48 h after transfection. Total cell lysates and the anti-myc immunoprecipitates were analyzed by Western blotting.
Figure 3.
Figure 3.
Ubiquitination of Bora requires Plk1. (A) In vitro ubiquitination assay. In vitro–synthesized 35S-Bora was incubated, in the presence of MG132, with extracts of HeLa S3 cells arrested by a thymidine-nocodazole treatment (TN0) or by a double thymidine treatment (TT0). Samples were taken at the indicated times and assayed by SDS-PAGE. P-Bora, phosphorylated Bora. (B) In vitro ubiquitination assay described in A was performed in TN0 extracts for 60 min in the presence of GST-ubiquitin (lane 2) or GST plus nontagged ubiquitin (lane 3) and the ubiquitin conjugates were purified by Glutathione beads and assayed by SDS-PAGE. Lane 1, 10% input of 35S-Bora. White line indicates that intervening lanes have been spliced out. (C) TN0 extracts were either mock depleted or depleted by an anti-Plk1 antibody at 4°C for 1 h. Ubiquitination assay in the depleted extracts was performed as described in A and the depletion efficiency was determined by Western blotting. ID, immunodepletion. In lane 3, 1/10 of the extracts (relative to lanes 1 and 2) was loaded to determine the depletion efficiency.
Figure 4.
Figure 4.
Bora is ubiquitinated in a β-TrCP1–dependent manner. (A) Identification of the SCF–β-TrCP subunits as Bora-interacting proteins. Listed are peptides of Cul1, Skp1, and β-TrCP1/2 identified by mass spectrometry in the GFP–S-Bora complex together with their XCorr and DeltaCN scores. (B) Bora associates with β-TrCP1 in vivo. HA-β-TrCP1 was cotransfected into HeLa cells with either GFP-Bora (lane 1) or GFP (lane 2) and cells were harvested at 48 h after transfection. Cell lysates and the anti-GFP immunoprecipitates were assayed by Western blotting. (C) Endogenous Bora and SCF–β-TrCP interact during the degradation of Bora. HeLa S3 cells were synchronized as described in Fig. 1 A. Endogenous Bora was immunoprecipitated and associated proteins were analyzed by Western blotting. (D) Bora interacts with β-TrCP1 in a Plk1-dependent manner. TN0 extracts were either mock depleted or depleted of Plk1 as described in Fig. 3 C. In vitro–synthesized 35S-Bora was first incubated with depleted extracts and then with nonlabeled HA-β-TrCP1 that had been immunoprecipitated by the anti-HA antibody/protein A beads. Proteins associated with HA-β-TrCP1 beads were assayed by SDS-PAGE. IP-control corresponds to a control immunoprecipitation of HA-β-TrCP1 with nonspecific IgG. Input, 10% of Bora after incubation with the TN0 extracts. Numbers below lanes 2 and 5 represent β-TrCP1-bound Bora relative to their respective total inputs. (E) β-TrCP1 controls the levels of Bora in vivo. HeLa cells were transfected with HA-β-TrCP1 or HA-β-TrCP1-δF and then synchronized by a thymidine-nocodazole arrest. Mitotic cells were shaken off at 42 h after transfection and protein levels in mitotic cells were determined by Western blotting. (F) β-TrCP1 controls Bora half-life. HeLa cells were synchronized by a double thymidine treatment and transfected with a control siRNA (siControl) or a previously characterized siRNA targeting both β-TrCP1 and 2 (si β-TrCP1/2; Mailand et al., 2006) during the second thymidine arrest. At 8 h after release from the second thymidine arrest, cyclohexamine was added and cells harvested 0, 30, 60, 90, 120, and 150 min later. Half-life of Bora was determined by Western blotting.
Figure 5.
Figure 5.
The DSGxxT degron is required for Bora degradation. (A) The conserved β-TrCP degron in Bora from different species. Residues important for recognition by β-TrCP are underlined. (B) The β-TrCP degron is required for ubiquitination of Bora. In vitro ubiquitination assays were performed in TN0 extracts as described in Fig. 3 A. Bora-AA has both S497 and T501 mutated to A. (C) In vitro binding of HA-β-TrCP1 to Bora and Bora-AA were performed in nondepleted TN0 extracts, as described in Fig. 4 D. Numbers below lanes 2 and 5 represent β-TrCP1–bound Bora relative to their respective total inputs. (D and E) The β-TrCP degron is required for the association of Bora with β-TrCP1 but not for the association of Bora with Plk1 in vivo. HA-β-TrCP1 (D) or myc-Plk1 (E) was cotransfected into HeLa cells with either GFP (lane 1) or GFP-Bora (wild type or mutants) and cells were harvested 48 h after transfection. Cell lysates and the anti-GFP immunoprecipitates were assayed by Western blotting. (F) Plk1 phosphorylates the Bora degron. Recombinant MBP-Bora and MBP-Bora-AA were phosphorylated by purified recombinant Plx1 (X. laevis homologue of Plk1) in the presence of radioactive ATP. The kinetics of Plx1-mediated phosphorylation was quantified and plotted. The amounts of MBP-Bora and MBP-Bora-AA were determined by Coomassie blue staining (CB). ♦, Bora; •, Bora-AA. (G) The DSGxxT degron is recognized in vivo. HeLa cells were transfected with GFP, GFP-Bora, or GFP-Bora-AA and harvested as asynchronous culture (AS) at 34 h after transfection or as prometaphase cells (TN0) at 48 h after transfection after a thymidine-nocodazole arrest. Total cell lysates were analyzed by Western blotting. Arrowheads point to the active and phosphorylated Aurora A (Hirota et al., 2003).
Figure 6.
Figure 6.
Expression of nondegradable Bora accumulates cells in mitosis and delays anaphase onset. (A–C) Control, GFP-rBora, GFP-rBora c1, and GFP-rBora c2 cells were collected at G2 (TT8) or in mitosis (TN0), and the levels of GFP fusion proteins and endogenous (endo) Bora were analyzed by Western blotting (A and B). Mitotic index of unsynchronous cells were determined by FACS (n > 20,000 cells) and plotted (C). (D–F) Kinetics of mitotic progression in control, GFP-rBora, GFP-rBora-c1, and GFP-rBora-c2 cells was analyzed by time-lapse microscopy upon transient transfection of GFP-histone H2B. The levels of GFP fusion proteins in stable cell lines were far below that of GFP-H2B. Cell images were captured every 3 min and the durations of prometaphase and metaphase were quantified by counting more than 40 mitotic cells in each transfection (D). Still frames from movies of representative cells were shown in E for GFP-rBora and in F for GFP-rBora-AA-c1. Arrowheads point to unaligned chromosomes. (G) Control, GFP-rBora, GFP-rBora-c1, and GFP-rBora-c2 cells were stained for β-tubulin, and DNA and distribution of metaphase cells (n > 70 metaphase cells) were quantified. (H and I) Localization of Plk1 (H) and Aurora A (I) were shown in maximum projections from deconvolved z stacks of representative metaphase cells stained for DNA and Plk1 (H) or Aurora A (I). Images in each channel were acquired under constant exposure and processed identically for different cell lines. Arrowheads point to centrosome regions. Insets in H show centrosomal Plk1 signals, and the numbers below images indicate the relative centrosomal Plk1 signal intensity. (J) Velocity of sister chromatid segregation at anaphase A was measured from the time-lapse movies shown in D–F (n > 42 anaphase cells for each quantification). Error bars show standard error. Bars: (E and F) 10 μm; (H and I) 5 μm.
Figure 7.
Figure 7.
Knockdown of Bora delays anaphase onset. (A and B) Analysis of Bora knockdown efficiency. HeLa cells were either control transfected or transfected with siRNAs targeting three regions of the Bora gene (siBora-A, -B, and -C and a mixture of all three) and collected at 52 h after transfection. Protein levels were determined by Western blotting (A) and cell cycle profile was determined by FACS (n > 20,000 cells; B). (C–E) Kinetics of mitotic progression in control and Bora-depleted cells was analyzed by time-lapse microscopy in HeLa cells stably expressing GFP-histone H2B. Cell images were captured every 3 min and the durations of prometaphase and metaphase were quantified by counting more than 50 mitotic cells in each transfection (C). Still frames from movies of representative cells are shown in D for control transfection and in E for Bora knockdown. Arrowheads point to unaligned chromosomes. (F–I) Analysis of tension across sister kinetochores (F and G) and the spindle checkpoint signals (H and I). Shown in F and H are maximum projections from deconvolved z stacks of representative control or Bora-depleted HeLa cells stained for Hec1 (red), CREST (green; F) or BubR1 (green; H), and DNA (blue). Insets show a single z slice of the boxed regions. Interkinetochore (Inter-KT) distance was quantified (n > 45 kinetochore pairs for each category) and plotted (G). Hec1 and BubR1 (n = 60 kinetochores) signals were quantified in 10 control and Bora-depleted cells (I). The BubR1 kinetochore signal normalized with the Hec1 intensity of the same kinetochores was also plotted. For metaphase cells, only chromosomes aligned at the metaphase plate were quantified in I. The siBora metaphase without unaligned category in G represents chromosomes in metaphase cells (F4) that contain no unaligned chromosomes. The siBora metaphase with unaligned category represents chromosomes on the metaphase plate in knockdown cells (F3) that contain unaligned chromosomes. The unaligned chromosomes in these cells (F3) were quantified in a separate category (siBora unaligned). Error bars show standard error. Bar: (D and E) 10 μm; (F and H) 5 μm.
Figure 8.
Figure 8.
Bora controls spindle stability and microtubule growth in mitosis. (A–E) Shown in A, B, and D are maximum projections from deconvolved z stacks of representative HeLa cells stained for β-tubulin (red) and DNA (blue). Cells were transfected with siRNA (A–C) or with GFP/GFP-Bora (D and E). Transfected cells were treated with 5 μg/ml nocodazole for 10 min at 37°C, washed, released into fresh media, and fixed at 0 min (A) and 6 min (B–E) after release. Centrosomes are marked by arrowheads in B. Images from representative cells were acquired under constant exposure. The amounts of microtubules repolymerized at 6 min after release were quantified from 10 mitotic cells in each transfection and plotted in C and E. (F and G) Shown in F are maximum projections from deconvolved z stacks of representative control or Bora-depleted HeLa cells stained for acetylated α-tubulin (red), HURP (green), and DNA (blue). Images from representative cells were acquired under constant exposure. Mean HURP and acetylated α-tubulin immunofluorescence intensities on metaphase spindles was quantified (n = 20 half-spindles from 10 cells; G). Acetylated α-tubulin signal normalized against the HURP intensity of the same cell was also plotted. (H–J) Control and GFP-rBora–expressing HeLa cells were transfected with a control siRNA or with siBora-A and the knockdown efficiency was determined by Western blotting (H). Long exposure of Western blot uncovered cross reacting bands (H, arrows), one of which comigrated with GFP-rBora. The levels of acetylated α-tubulin were assayed by immunofluorescence staining (I), quantified, and plotted (J). (K) Velocity of sister chromatid segregation at anaphase A was measured in control and Bora knockdown cells from time-lapse movies shown in Fig. 7 (D and E; n = 32 anaphase cells for each quantification). AU, arbitrary units. Error bars show standard error. Bars, 5 μm.

Similar articles

Cited by

References

    1. Ang, X.L., and J. Wade Harper. 2005. SCF-mediated protein degradation and cell cycle control. Oncogene. 24:2860–2870. - PubMed
    1. Barr, A.R., and F. Gergely. 2007. Aurora-A: the maker and breaker of spindle poles. J. Cell Sci. 120:2987–2996. - PubMed
    1. Barr, F.A., H.H. Sillje, and E.A. Nigg. 2004. Polo-like kinases and the orchestration of cell division. Nat. Rev. Mol. Cell Biol. 5:429–440. - PubMed
    1. Bennett, L.N., and P.R. Clarke. 2006. Regulation of Claspin degradation by the ubiquitin-proteosome pathway during the cell cycle and in response to ATR-dependent checkpoint activation. FEBS Lett. 580:4176–4181. - PubMed
    1. Bern, M., D. Goldberg, W.H. McDonald, and J.R. Yates III. 2004. Automatic quality assessment of peptide tandem mass spectra. Bioinformatics. 20:I49–I54. - PubMed

Publication types

Substances