. 2008 Apr 14;205(4):939-49.
doi: 10.1084/jem.20072141. Epub 2008 Mar 31.

A minimal binding footprint on CD1d-glycolipid is a basis for selection of the unique human NKT TCR

Affiliations

A minimal binding footprint on CD1d-glycolipid is a basis for selection of the unique human NKT TCR

Kwok S Wun et al. J Exp Med. .

Abstract

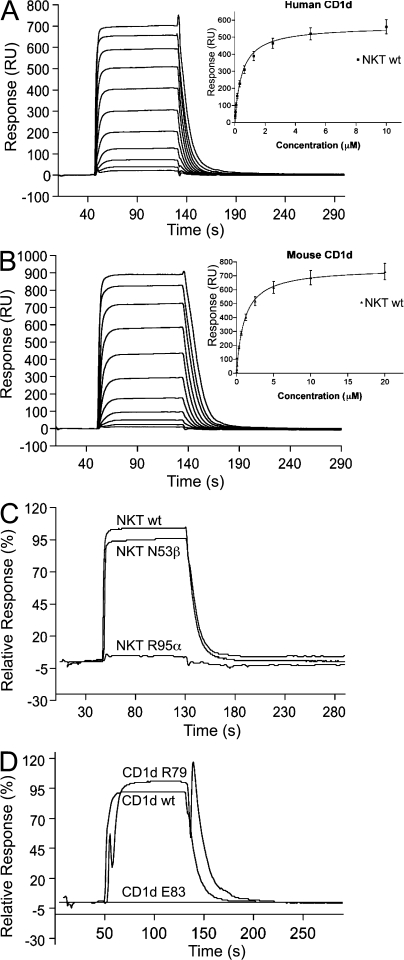
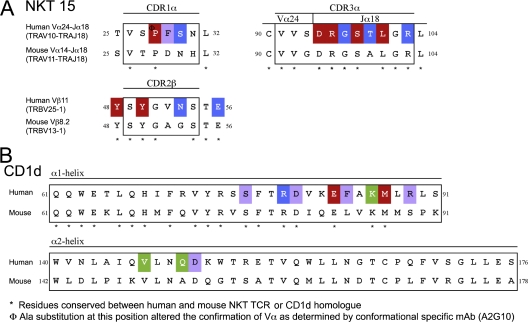
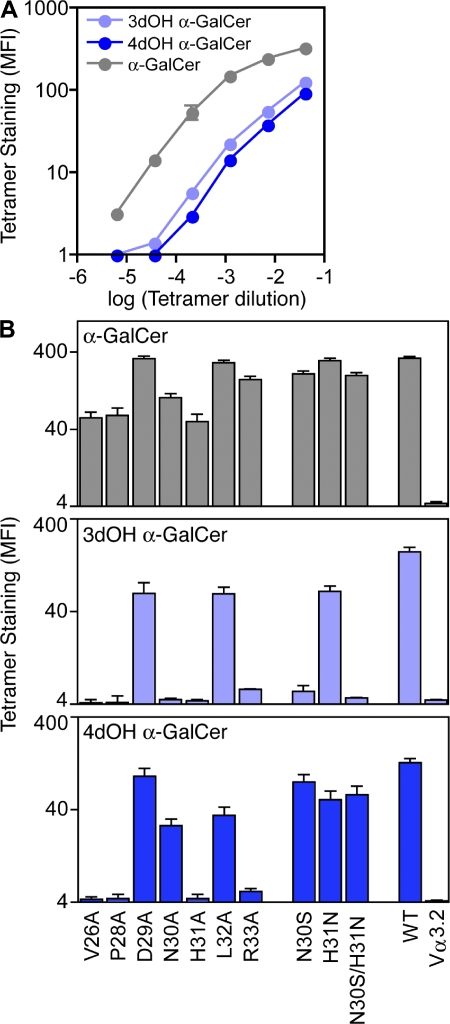
Although it has been established how CD1 binds a variety of lipid antigens (Ag), data are only now emerging that show how alphabeta T cell receptors (TCRs) interact with CD1-Ag. Using the structure of the human semiinvariant NKT TCR-CD1d-alpha-galactosylceramide (alpha-GalCer) complex as a guide, we undertook an alanine scanning mutagenesis approach to define the energetic basis of this interaction between the NKT TCR and CD1d. Moreover, we explored how analogues of alpha-GalCer affected this interaction. The data revealed that an identical energetic footprint underpinned the human and mouse NKT TCR-CD1d-alpha-GalCer cross-reactivity. Some, but not all, of the contact residues within the Jalpha18-encoded invariant CDR3alpha loop and Vbeta11-encoded CDR2beta loop were critical for recognizing CD1d. The residues within the Valpha24-encoded CDR1alpha and CDR3alpha loops that contacted the glycolipid Ag played a smaller energetic role compared with the NKT TCR residues that contacted CD1d. Collectively, our data reveal that the region distant to the protruding Ag and directly above the F' pocket of CD1d was the principal factor in the interaction with the NKT TCR. Accordingly, although the structural footprint at the NKT TCR-CD1d-alpha-GalCer is small, the energetic footprint is smaller still, and reveals the minimal requirements for CD1d restriction.


Figures

Figure 1.
Figure 1.
A NKT TCR CDR3α and CDR2β loop contacts dominate CD1d-mediated interactions. (A) Residues on the NKT TCR important for recognizing CD1d–α-GalCer. (B) CDR1α loop interacts solely with α-GalCer galactose head group. (C) CDR3α loop mediates multiple contacts between CD1d α-helices and α-GalCer. (D) CDR3β loop contacts with the CD1d α2-helix. (E) Residues within and next to the CDR2β loop make polar interactions with the CD1d α1-helix. Pink, α-GalCer; yellow, CDR1α loop; cyan, CDR3α; orange; CDR2β loop; blue, CDR3β loop; grey, CD1d α-helices. H-bond or salt-bridge interactions, dotted lines. In Fig. 1 (B–E), substituted residues with a >10-fold reduction in affinity are shown in red; with a 4–6-fold reduction in affinity are shown in green; and with a <4-fold reduction in affinity are shown in blue.
Figure 2.
Figure 2.
Binding analysis of NKT TCR to human and mouse CD1d–α-GalCer using surface plasmon resonance. A concentration series of the WT NKT TCR was passed over human CD1d–α-GalCer (A) and mouse CD1d–α-GalCer (B). (insets) The equilibrium response versus concentration. (C) Comparison of the relative response of 10 μM of the WT NKT TCR and the Asn53β and Arg95α mutant NKT TCRs to human CD1d–α-GalCer. (D) Comparison of the relative response of 6.25 μM WT NKT TCR to WT human CD1d–α-GalCer and the CD1d mutant proteins carrying Arg79 and Glu83 substitutions.
Figure 3.
Figure 3.
Sequence alignment of CD1d and the NKT TCR from both human and mouse. Sequence comparison of the CDR1α, CDR3α, and CDR2β loops of the mouse and human NKT TCR homologues (A) and the CD1d α1- and α2-helices (B). Substituted residues that have a >10-fold reduction in affinity are shown in red; a 4–6-fold reduction in affinity are shown in green; and a <4-fold reduction in affinity are shown in blue; residues that contact either CD1d–α-GalCer or the NKT TCR that were not substituted, purple.
Figure 4.
Figure 4.
Energetic hotspots. (A) The NKT TCR hotspot. Surface representation of the NKT TCR molecule. Yellow, Vα; pale blue, Vβ. The NKT TCR CDR1α, 3α, 2β, and 3β loops and the CD1d α1- and α2-helices are shown as a cartoon representation. (B) The human CD1d hotspot. Surface representation of the human CD1d molecule presenting α-GalCer (pink ball and stick). A cartoon representation of the CD1d α-helices and selected CDR loops are also displayed (C) Critical residues for NKT TCR–CD1d–α-GalCer recognition are biased toward the F′ pocket region. Substituted residues that have >10-fold reduction in affinity are shown in red; 4–6-fold reduction in affinity are shown in green; <4-fold reduction in affinity are shown in blue; residues that were not substituted are shown in purple; α-GalCer is shown in pink; CDR1α loop is shown in yellow; CDR3α is shown in cyan; CDR2β loop is shown in orange; CDR3β loop is shown in blue; and CD1d α-helices are shown in grey.
Figure 5.
Figure 5.
α-GalCer analogues. (A) Hybridomas expressing wild-type mouse Vα14i TCRα chain were subjected to staining with the indicated dilutions of mouse CD1d tetramers left unloaded or loaded with α-GalCer, 3′deoxy-α-GalCer, or 4′deoxy-α-GalCer, and mean fluorescence intensity (MFI) of tetramer staining was determined from a thin TCR gate. MFI of background staining with unloaded tetramer was determined for each concentration and subtracted from the MFI of loaded tetramer. Data points represent the mean of MFI ± the range from two independent experiments. (B) Hybridomas expressing WT or indicated mutations of mouse Vα14i TCRα chain were subjected to staining with mouse CD1d tetramers loaded with α-GalCer (top), 3′deoxy-α-GalCer (middle), or 4′deoxy-α-GalCer (bottom). Nonmutated Vα14-Jα18 TCRα chain served as the WT control. The negative control was a Vα14-Jα18 construct in which the Vα14 CDR1 region was swapped for the Vα3.2 CDR1α region (Vα3.2). MFI of tetramer staining for all mutants was determined from a thin TCR gate. Error bars represent the mean of MFI ± the range for two independent experiments.

References

    1. Zinkernagel, R.M., and P.C. Doherty. 1997. The discovery of MHC restriction. Immunol. Today. 18:14–17. - PubMed
    1. Brigl, M., and M.B. Brenner. 2004. CD1: antigen presentation and T cell function. Annu. Rev. Immunol. 22:817–890. - PubMed
    1. Ulrichs, T., and S.A. Porcelli. 2000. CD1 proteins: targets of T cell recognition in innate and adaptive immunity. Rev. Immunogenet. 2:416–432. - PubMed
    1. Moody, D.B., D.M. Zajonc, and I.A. Wilson. 2005. Anatomy of CD1-lipid antigen complexes. Nat. Rev. Immunol. 5:387–399. - PubMed
    1. Kobayashi, E., K. Motoki, T. Uchida, H. Fukushima, and Y. Koezuka. 1995. KRN7000, a novel immunomodulator, and its antitumor activities. Oncol. Res. 7:529–534. - PubMed

Publication types

MeSH terms