. 2008 Apr 14;205(4):897-913.
doi: 10.1084/jem.20071046. Epub 2008 Mar 31.

IL-9- and mast cell-mediated intestinal permeability predisposes to oral antigen hypersensitivity

Affiliations

IL-9- and mast cell-mediated intestinal permeability predisposes to oral antigen hypersensitivity

Elizabeth E Forbes et al. J Exp Med. .

Abstract

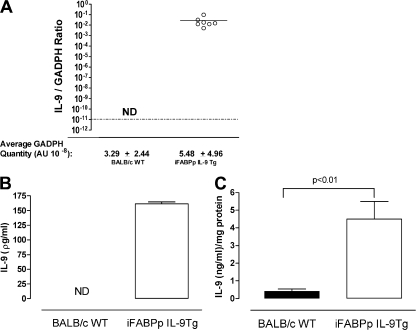
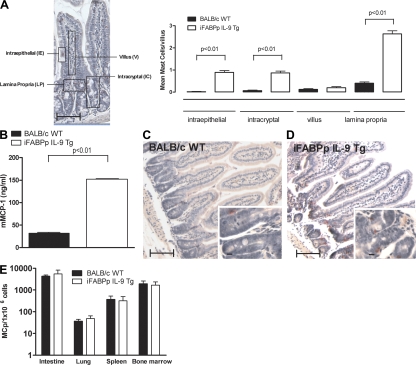
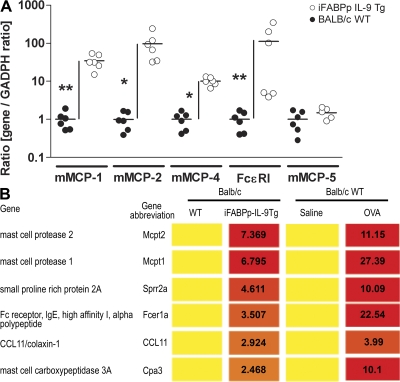
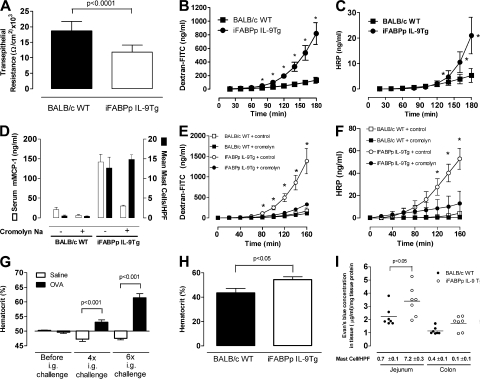
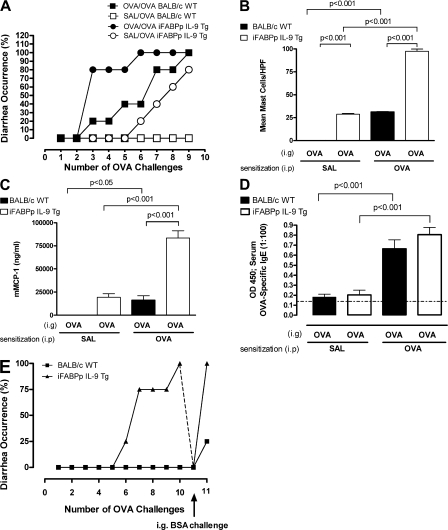
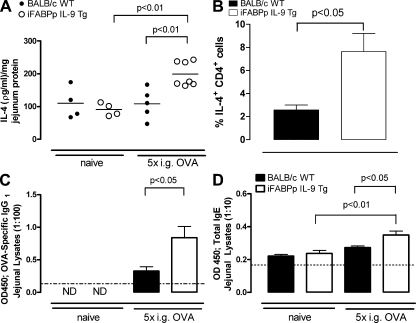
Previous mouse and clinical studies demonstrate a link between Th2 intestinal inflammation and induction of the effector phase of food allergy. However, the mechanism by which sensitization and mast cell responses occurs is largely unknown. We demonstrate that interleukin (IL)-9 has an important role in this process. IL-9-deficient mice fail to develop experimental oral antigen-induced intestinal anaphylaxis, and intestinal IL-9 overexpression induces an intestinal anaphylaxis phenotype (intestinal mastocytosis, intestinal permeability, and intravascular leakage). In addition, intestinal IL-9 overexpression predisposes to oral antigen sensitization, which requires mast cells and increased intestinal permeability. These observations demonstrate a central role for IL-9 and mast cells in experimental intestinal permeability in oral antigen sensitization and suggest that IL-9-mediated mast cell responses have an important role in food allergy.


Figures

Figure 1.
Figure 1.
Oral antigen–induced intestinal anaphylaxis is attenuated in IL-9–deficient mice. Diarrhea occurrence (A) and mean number of mast cells per high power field (HPF; B) in the intestine of OVA-sensitized and subsequently i.g. saline- or OVA-challenged BALB/c WT and IL-9−/− mice. (C and D) Photomicrograph of CAE–stained jejunal sections from OVA-sensitized and -challenged BALB/c IL-9−/− and WT mice. Serum mouse mast cell protease-1 (E) and serum OVA-specific IgE (F) in saline- or OVA-sensitized, OVA-challenged BALB/c WT and IL-9−/− mice. Mean number of mast cells per HPF (G) and mast cell progenitor numbers (H) in the intestine under basal conditions in BALB/c WT and IL-9−/− mice. (A) Data are represented as the percentage of diarrhea occurrence over the number of OVA challenges. (B, E, and F) Data are represented as the mean ± the SEM; 4–5 mice per group from n = 3 experiments. (C and D) Photomicrograph, 10× magnification; insert, 40× magnification. Saline/OVA indicate saline-sensitized i.g. OVA-challenged mice and OVA/OVA indicate OVA-sensitized i.g. OVA-challenged mice. (G) Data represented as the mean ± the SEM; 4–5 mice per group from n = 4 experiments. (H) Data represented as the mean ± the SEM; 4 mice per group. Bars: (capped) 100 μm; (uncapped) 10 μm.
Figure 2.
Figure 2.
Increased systemic and intestinal IL-9 in iFABPp-IL-9Tg mice. (A) Quantitative PCR analysis of IL-9 mRNA expression in the jejunum and IL-9 protein levels in the sera (B) and jejunum (C) of WT and iFABPp-IL-9Tg mice. Open circles in A represent individual mice. Data are represented as the mean ± the SEM; 4–5 mice per group from n = 3 experiments.
Figure 3.
Figure 3.
Intestinal mastocytosis in iFABPp-IL-9Tg mice. Localization of mean number of mast cells in the small intestine (A) and serum mMCP-1 in WT and iFABPp-IL-9Tg mice (B). (C and D) Photomicrograph of CAE-stained jejunum sections of BALB/c WT (C) and iFABPp-IL-9Tg mice (D). (E) Mast cell progenitor levels in the intestine, lung, spleen and BM of iFABPp-IL-9Tg and BALB/c WT mice. (A–E) Data represented as the mean ± the SEM; 4–5 mice per group from n = 4 experiments. A is a pictorial representation of localization determination. (C and D) Photomicrograph, 10× magnification; insert, 40× magnification. (E) Data represented as the mean ± the SEM; 4 mice per group. Bars: (capped) 100 μm; (uncapped) 10 μm.
Figure 4.
Figure 4.
Overexpression of IL-9 in the intestine induces features of an intestinal anaphylaxis genotype. (A) Quantitative PCR analysis of mast cell gene mRNA expression in the jejunum of iFABPp-IL-9Tg and BALB/c WT. Results are expressed as the gene/GADPH ratio in respect to fold change over BALB/c WT. Gene expression was normalized to GADPH expression in each individual sample. Circles represent individual mice and black line represents mean value in each group (B) Genome-wide expression gene profile comparative analysis of iFABPp-IL-9Tg and BALB/c WT mice compared with OVA-sensitized, OVA-challenged BALB/c WT mice (6). Values represent fold increase over respective control. The complete dataset is available at the NCBI gene expression Omnibus (http://www.ncbi.nlm.gov) accession no. GSE10658.
Figure 5.
Figure 5.
Overexpression of IL-9 in the intestine induces features of an intestinal anaphylaxis phenotype including mast cell–dependent increased intestinal permeability and intravascular leakage. Transepithelial resistance (A) and intestinal permeability measured by FITC-dextran (B) and horseradish peroxidase (HRP; C) transport in jejunal segments ex vivo for iFABPp-IL-9Tg and BALB/c WT mice, serum mouse mast cell protease-1 and mean number of mast cells per high power field (hpf; D) and intestinal permeability measured by FITC-dextran (E) and HRP (F) transport in jejunal segments ex vivo for iFABPp-IL-9Tg and BALB/c WT mice treated with control or the mast cell stabilizing agent cromolyn sodium. (G) Percentage of hematocrit before and after 4× or 6× i.g. saline or OVA challenges of OVA-sensitized BALB/c WT mice. Percentage of hematocrit in iFABPp-IL-9Tg mice compared with BALB/c WT (H) and Evans blue extravasation in the jejunum and colon of iFABPp-IL-9Tg and BALB/c WT mice (I). (B) Data represents genes found to be up-regulated from profile analysis. (C–G) Data represented as the mean ± the SEM; 4–5 mice per group. (I) Data represents Evans blue concentration in jejunum and colon normalized per milligram of tissue protein. Black line represents mean value in each group.
Figure 6.
Figure 6.
Overexpression of IL-9 in the intestine increases susceptibility to oral antigen–induced intestinal anaphylaxis. Diarrhea occurrence (A), mean number of mast cells per high power field (hpf; B), serum mouse mast cell protease-1 (C), and serum antigen-specific IgE (D) in OVA- or saline-sensitized and subsequently OVA-challenged BALB/c WT and iFABPp-IL-9Tg mice. (E) Diarrhea occurrence in OVA-challenged BALB/c WT and iFABPp-IL-9Tg mice and subsequently challenged with BSA. (A) Data represented as the percentage of diarrhea occurrence over number of OVA challenges. (B–D) Data are represented as the mean ± the SEM; 4–5 mice per group from n = 3 experiments. (E) Data are represented as the percentage of diarrhea occurrence over the number of OVA challenges, and then subsequent BSA challenge.
Figure 7.
Figure 7.
Overexpression of IL-9 in the intestine increases local Th2 responses after OVA i.g. challenge. IL-4 protein levels in jejunal lysates (A) and percentage of CD4+ IL-4+ cells (B) in the lamina propria of the jejunum of BALB/c WT and iFABPp-IL-9Tg mice after i.g. OVA challenges. Antigen-specific IgG1 (C) and total IgE protein levels (D) in jejunal lysates from BALB/c WT and iFABPp-IL-9Tg mice under basal conditions and after 5 i.g. OVA challenges. (A) Data are expressed as protein level in picograms/milliliter per milligram protein. In A, each circle represents an individual mouse, and the black line represents the mean value in each group. (A–D) Data are represented as the mean ± the SEM; 4–5 mice per group from at least n = 2 experiments. Dotted line depicts the detection limit.
Figure 8.
Figure 8.
Treatment with mast cell stabilizing agent cromolyn sodium blocks intestinal permeability and protects against antigen sensitization. (A) Experimental regimen. Diarrhea occurrence (B), total serum IgE for iFABPp-IL-9Tg and BALB/c WT mice treated with control or the mast cell stabilizing agent cromolyn sodium and subsequently OVA-challenged mice (C). (D) Passive anaphylaxis (maximum temperature decrease over 20 min) in iFABPp-IL-9Tg mice treated with control or the mast cell stabilizing agent cromolyn sodium. After the 9th OVA i.g. challenge, the mice were i.v. administered IgE-anti-TNP and subsequently i.v. injected withTNP-BSA. (A–D) Data represented as the mean ± the SEM; 4–5 mice per group. (A) Data are represented as the percentage of diarrhea occurrence over the number of OVA challenges in iFABPp-IL-9Tg and BALB/c WT mice treated with control or the mast cell stabilizing agent cromolyn sodium.

References

    1. Sampson, H.A. 1999. Food allergy. Part 1: immunopathogenesis and clinical disorders. J. Allergy Clin. Immunol. 103:717–728. - PubMed
    1. Sampson, H.A. 2003. Food Allergy. J. Allergy Clin. Immunol. 111:S540–S547. - PubMed
    1. Eigenmann, P.A. 2002. T lymphocytes in food allergy: overview of an intricate network of circulating and organ-resident cells. Pediatr. Allergy Immunol. 13:162–171. - PubMed
    1. Eigenmann, P.A., S.K. Huang, D.G. Ho, and H.A. Sampson. 1996. Human T cell clones and cell lines specific to ovomucoid recognize different domains and consistently express IL-5. Adv. Exp. Med. Biol. 409:217. - PubMed
    1. Turcanu, V., S.J. Maleki, and G. Lack. 2003. Characterization of lymphocyte responses to peanuts in normal children, peanut-allergic children, and allergic children who acquired tolerance to peanuts. J. Clin. Invest. 111:1065–1072. - PMC - PubMed

Publication types

MeSH terms