. 2008 Apr;131(4):365-78.
doi: 10.1085/jgp.200809956.

Tl+-induced micros gating of current indicates instability of the MaxiK selectivity filter as caused by ion/pore interaction

Affiliations

Tl+-induced micros gating of current indicates instability of the MaxiK selectivity filter as caused by ion/pore interaction

Indra Schroeder et al. J Gen Physiol. 2008 Apr.

Abstract

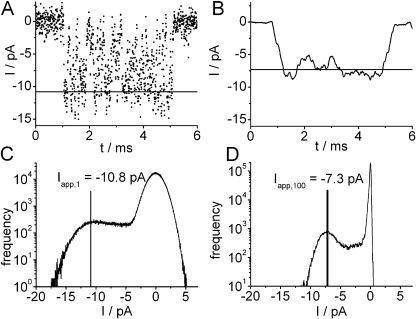
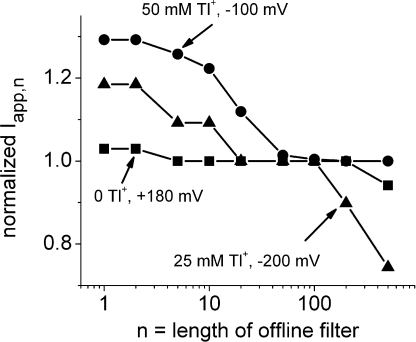
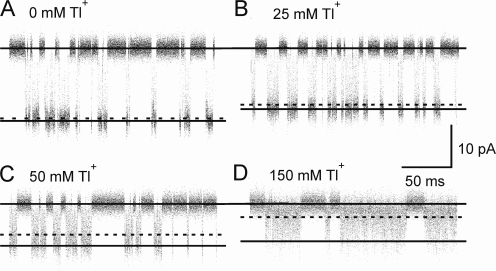
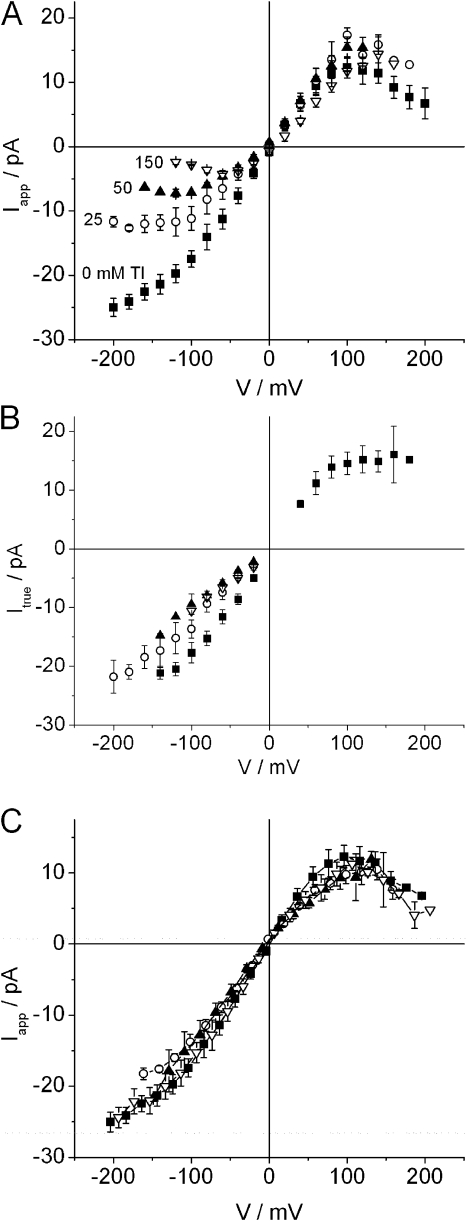
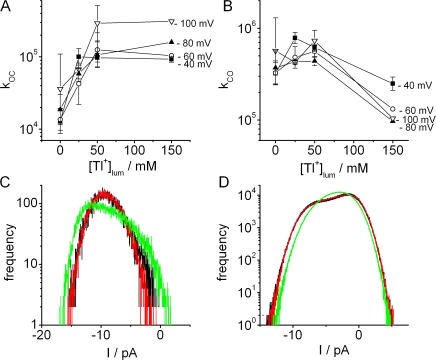
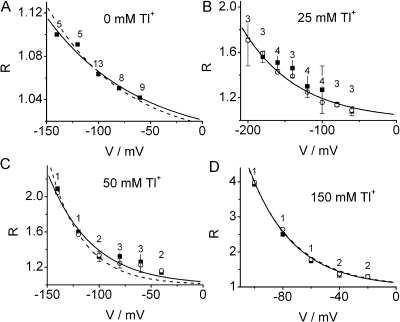
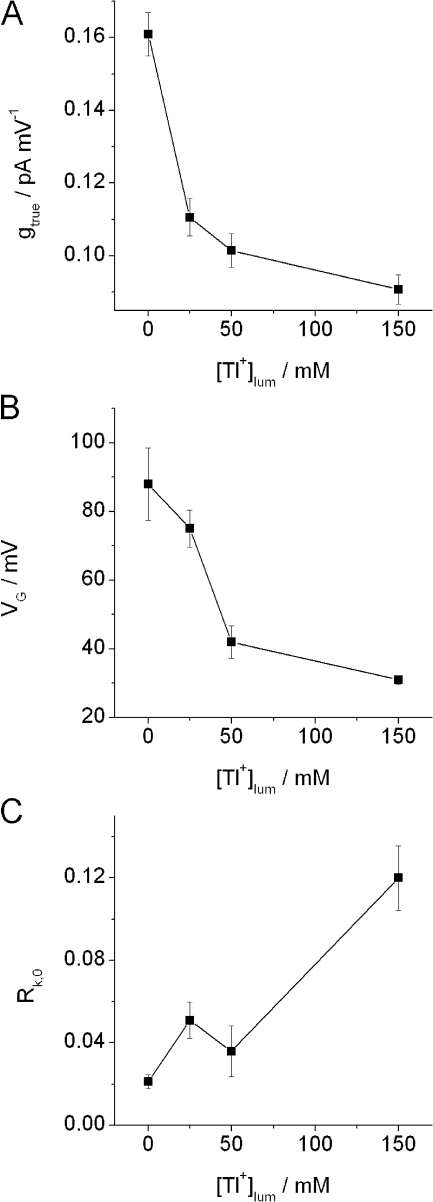
Patch clamp experiments on single MaxiK channels expressed in HEK293 cells were performed at high temporal resolution (50-kHz filter) in asymmetrical solutions containing 0, 25, 50, or 150 mM Tl+ on the luminal or cytosolic side with [K+] + [Tl+] = 150 mM and 150 mM K+ on the other side. Outward current in the presence of cytosolic Tl+ did not show fast gating behavior that was significantly different from that in the absence of Tl+. With luminal Tl+ and at membrane potentials more negative than -40 mV, the single-channel current showed a negative slope resistance concomitantly with a flickery block, resulting in an artificially reduced apparent single-channel current I(app). The analysis of the amplitude histograms by beta distributions enabled the estimation of the true single-channel current and the determination of the rate constants of a simple two-state O-C Markov model for the gating in the bursts. The voltage dependence of the gating ratio R = I(true)/I(app) = (k(CO) + k(OC))/k(CO) could be described by exponential functions with different characteristic voltages above or below 50 mM Tl(+). The true single-channel current I(true) decreased with Tl+ concentrations up to 50 mM and stayed constant thereafter. Different models were considered. The most likely ones related the exponential increase of the gating ratio to ion depletion at the luminal side of the selectivity filter, whereas the influence of [Tl+] on the characteristic voltage of these exponential functions and of the value of I(true) were determined by [Tl+] at the inner side of the selectivity filter or in the cavity.


Figures

Figure 1.
Figure 1.
Dwell-time histograms of the open (A, C, E, and G) and the closed (B, D, F, and H) states obtained from MaxiK channels in the presence and absence of Tl+ with the following solutions: 150 mM KNO3 on both sides (‘K+’, black), 50 mM Tl+ and 100 mM K+ on the luminal side (Tl+ lum, green) or on the cytosolic side (Tl+ cyt, red). On the opposite side there was always 150 mM KNO3. 2.5 mM Mg(NO3)2 and 2.5 mM Ca(NO3)2 were included in all solutions. For the sake of clarity, only representative error bars are given, which were obtained from averaging over the error bars of bins of 25% of the τ value.
Figure 2.
Figure 2.
The effect of filtering on the apparent single-channel current. (A and C) No moving average filter (=raw data). (B and D) The same data with moving average filter over 100 data points separated by 5 μs. (A and B) The horizontal lines present Iapp as obtained by fit-by-eye (Riessner et al., 2002). (C and D) The vertical lines present Iapp as obtained from the maxima of the amplitude histograms of the time series above them. The time series was recorded at −120 mV with 50 mM Tl+ + 100 mM K+ in the pipette (luminal) and 150 mM K+ in the bathing medium (cytosolic).
Figure 3.
Figure 3.
Dependence of Iapp,n on the number n of data points included in offline averaging. Results from three representative time series are shown.
Figure 4.
Figure 4.
Sections of four current records with different K+/Tl+ mixtures on the luminal side (pipette). [Tl+] is given at the traces with [K+] = 150 mM − [Tl+]. Cytosolic solution contained 150 mM K+. Membrane potential was −100 mV for all records. Channel openings result in downward deflections. With increasing Tl+ concentration, the open-channel noise increases and the apparent current decreases, indicating the increase of unresolved gating events. The upper horizontal lines give the baseline (closed channel). The dotted lines show the apparent current Iapp,∞ taken from the plateau in Fig. 3. Iapp,1 obtained from fit-by-eye (Riessner et al., 2002) is presented by solid horizontal lines.
Figure 5.
Figure 5.
(A) Apparent (Iapp,100) and (B) true single-channel IV curves of MaxiK with different luminal K+/Tl+ mixtures (pipette). The Tl+ concentrations are attached to the curves with [Tl+] + [K+] = 150 mM. (C). Apparent IV curves obtained with cytosolic K+/Tl+ mixtures (bath). Besides in the region of the negative slope at positive potentials, Iapp and Itrue are identical.
Figure 6.
Figure 6.
Dependence of the rate constants of a two-state model on luminal Tl+ concentration at different membrane potentials as obtained from the β distributions of the current amplitudes in the bursts for (A) kOC and (B) kCO. C and D present tests of whether the absolute values in A and B are determined correctly. The black histograms are generated from the measured time series. The coinciding red curves result from simulated time series using the rate constants in A and B with (C) 50 mM Tl+ at −100 mV and (D) 150 mM Tl+ at −80 mV (a = 1 in Eq. 2). The deviating histograms (green) are obtained by multiplying the rate constants kCO and kOC in Eq. 2 with a common factor of (C) a = 0.33 and (D) a = 2.
Figure 7.
Figure 7.
Dependence of the gating factor Rk (closed squares, Eq. 4a) and RI (open circles, Eq. 4b) on membrane potential as calculated from the data in Fig. 6, A and B, and Fig. 5, A and B, respectively. The flickering bursts occurring in records at 50 mM Tl+ were very short due to sojourns in very short closed events. There, Iapp,∞ was obtained from the expectance of current from the distributions per level (Schroeder et al., 2004). They coincided with Iapp,k, indicating the high reliability of the β fit. The smooth lines present the free fits of Rk (Eq. 5, with the parameters in Table I). Dashed lines are joint fits for 0/25 mM Tl+ and 50/150 mM Tl+, respectively. Errors bars represent SEM. Number of data points are given at the curves.
Figure 8.
Figure 8.
Dependence of (A) true single-channel conductivity gtrue from Fig. 5 B, (B) characteristic voltage VG (Fig. 7, Eq. 5), and (C) amplitude factor Rk,0 (Fig. 7, Eq. 5) on [Tl+] with [Tl+] + [ K+] = 150 mM. Data from Table I, free fit.

Similar articles

Cited by

References

    1. Alagem, N., M. Dvir, and E. Reveny. 2001. Mechanism of Ba2+ block of a mouse inwardly rectifying K+ channel: differential contribution by two discrete residues. J. Physiol. 534:381–393. - PMC - PubMed
    1. Bernèche, S., and B. Roux. 2000. Molecular dynamics of the KcsA K+ channel in a bilayer membrane. Biophys. J. 78:2900–2917. - PMC - PubMed
    1. Bernèche, S., and B. Roux. 2005. A gate in the selectivity filter of potassium channels. Structure. 13:591–600. - PubMed
    1. Bezanilla, F., and C.M. Armstrong. 1972. Negative conductance caused by the entry of sodium and cesium ions into the K channels of squid axon. J. Gen. Physiol. 60:588–608. - PMC - PubMed
    1. Bichet, D., M. Grabe, Y.N. Jan, and L.Y. Jan. 2006. Electrostatic interactions in the channel cavity as an important determinant of potassium channel selectivity. Proc. Natl. Acad. Sci. USA. 103:14355–14360. - PMC - PubMed

Publication types

MeSH terms

Substances