. 2008 Apr 8;105(14):5332-6.
doi: 10.1073/pnas.0711911105. Epub 2008 Mar 31.

Reproductive conflict and the separation of reproductive generations in humans

Affiliations

Reproductive conflict and the separation of reproductive generations in humans

Michael A Cant et al. Proc Natl Acad Sci U S A. .

Abstract

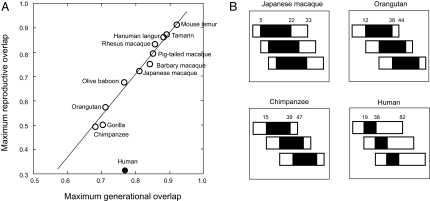
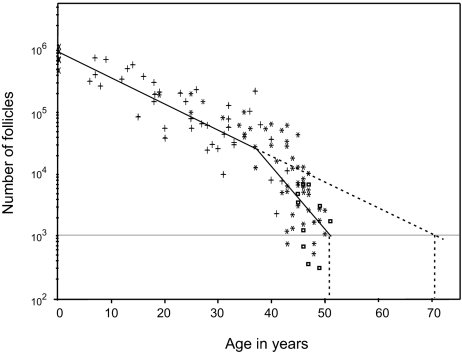
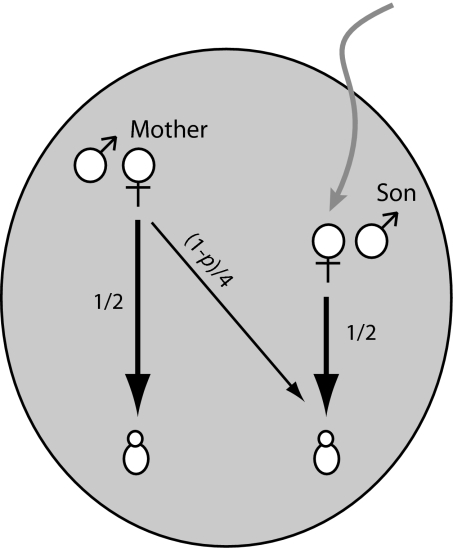
An enduring puzzle of human life history is why women cease reproduction midway through life. Selection can favor postreproductive survival because older females can help their offspring to reproduce. But the kin-selected fitness gains of helping appear insufficient to outweigh the potential benefits of continued reproduction. Why then do women cease reproduction in the first place? Here, we suggest that early reproductive cessation in humans is the outcome of reproductive competition between generations, and we present a simple candidate model of how this competition will be resolved. We show that among primates exhibiting a postreproductive life span, humans exhibit an extraordinarily low degree of reproductive overlap between generations. The rapid senescence of the human female reproductive system coincides with the age at which, in natural fertility populations, women are expected to encounter reproductive competition from breeding females of the next generation. Several lines of evidence suggest that in ancestral hominids, this younger generation typically comprised immigrant females. In these circumstances, relatedness asymmetries within families are predicted to give younger females a decisive advantage in reproductive conflict with older females. A model incorporating both the costs of reproductive competition and the benefits of grandmothering can account for the timing of reproductive cessation in humans and so offers an improved understanding of the evolution of menopause.


Conflict of interest statement

The authors declare no conflict of interest.

Figures

Figure. 1.
Figure. 1.
Reproductive overlap in humans and other primates. (A) Maximum reproductive versus maximum generational overlap in 12 primate species recently classed as exhibiting a postreproductive life span (24). Maximum generational overlap, G, is defined as (MLS − AFB)/MLS, where AFB is average age at first birth and MLS is maximum recorded life span. Maximum reproductive overlap, R, is defined as (MRS − AFB)/MRS, where MRS is the maximum reproductive span, calculated as maximum age at last birth (MALB) minus AFB. For species without a postreproductive life span, in which MRS ≈ MLS, it would follow that R = 2 − (1/G). For our sample species (excluding humans), the least-squares linear regression of R on G is shown (y = −0.74 + 1.78x, r2 = 0.98). This regression would predict a MALB for humans of 70 years on the basis of generational overlap. We used MLS and MALB because these are the parameters typically reported in the literature. For four species (chimpanzees, orangutans, Japanese macaques, and humans), published data were sufficiently detailed to calculate mean reproductive overlap, defined as (ARS − AFB)/ARS, where ARS is the average (or mean) reproductive span (i.e., mean ALB minus AFB). (B) Pattern of overlap for these four species. For each species, horizontal bars represent the maximum life spans of three successive generations, scaled to a standard length and offset in accordance with the value of AFB relative to MLS, with mean reproductive spans shaded. The mean reproductive overlap values for Japanese macaques, orangutans, and chimpanzees were 0.71, 0.52, and 0.39, respectively, compared with a mean reproductive overlap for humans of 0.00. Values (in years) and reference sources used to plot the figure are as follows. Common chimpanzee (Pan troglodytes): MLS = 47, AFB = 14.7, MALB = 43.8 [means of Mahale/Tai/Bossou/Gombe populations (–, –67)]), mean ALB = 38.9 (mean of Mahale/Tai/Gombe values for females that survived to the MALB of their respective populations). Gorilla (Gorilla gorilla): MLS = 35, AFB = 10, MALB = 30 (68, 69). Orangutan (Pongo pygmaeus): MLS = 44, AFB = 12.3, MALB = 41; mean ALB = 38 (70). Human (Homo sapiens): MLS = 82.5, AFB = 19.1, MALB = 47 [Ache/!Kung mean values (15, 25)], mean ALB = 38.2 [mean for Ache/!Kung females surviving to age 50 (15, 25)]. Olive baboon (Papio cynocephalus anubis): MLS = 27, AFB = 6, MALB = 25 (71). Japanese macaque (Macaca fuscata): MLS = 32.7, AFB = 5, MALB = 25.4 (72), mean ALB = 22.5 [mean for females surviving to MALB (72)]. Barbary macaque (Macaca sylvanus): MLS = 28, AFB = 4, MALB = 23 (73). Pig-tailed macaque (Macaca nemestrina): MLS = 28, ALB = 22, AFB = 5 (74). Rhesus macaque (Macaca mulatto): MLS = 19, MALB = 18 (69), AFB = 2.6 (75). Hanuman langur (Presbytis entellus): MLS = 35, AFB = 4, MALB = 32 (76). Tamarins (Sanguinus spp. (2 spp.): MLS = 20, MALB = 17 (77), AFB = 2 (75). Mouse lemur (Microcebus murinus): MLS = 14, MALB = 11 (78), AFB = 0.95 (75).
Fig. 2.
Fig. 2.
Number of follicles in pairs of human ovaries from neonatal age to 51 years. Note the logarithmic scale on the y axis. The solid line shows a fitted biphasic regression model (29, 30), which gives the best fit to the data compared with a range of alternative models [including those that assume a smooth acceleration in the rate of decline (29, 30, 79)]. This model assumes a constant exponential rate of follicular decline from birth to ≈38 years, after which the exponential rate parameter approximately doubles. The threshold minimum number of follicles required to maintain regular menstrual cycles (assumed to be ≈1,000) is reached at approximately age 50. Data are pooled from four autopsy studies, denoted by different symbols. [Redrawn with permission from ref. (copyright 1992, Oxford University Press).]
Figure. 3.
Figure. 3.
Relatedness asymmetry within families assuming female dispersal. Male and female symbols represent parents. A mother is related to the offspring of an immigrant female paired to her son by (1 − p)/4, where p is the probability of extra-pair paternity. The younger female, by contrast, is unrelated to the mother's offspring.

Similar articles

Cited by

References

    1. Moss CJ. The demography of an African elephant (Loxodonta africana) population in Amboseli, Kenya. J Zool. 2001;255:145–156.
    1. Mizroch SA. Analyses of some biological parameters of the Antarcticfin whale (Balaenopter physalus) Rep Int Whaling Comm. 1981;31:425–434.
    1. Wood JW. Dynamics of Human Reproduction. New York: de Gruyter; 1994.
    1. Blurton-Jones NG, Hawkes K, O'Connell JF. Antiquity of postreproductive life: Are there modern impacts on hunter–gatherer postreproductive life spans? Am J Hum Biol. 2002;14:184–205. - PubMed
    1. Williams GC. Pleiotropy, natural selection, and the evolution of senescence. Evolution (Lawrence, Kans) 1957;11:398–411.

Publication types