

Up-regulation of a cellular protein at the translational level by a retrovirus
- PMID: 18378896
- PMCID: PMC2291115
- DOI: 10.1073/pnas.0710526105
Up-regulation of a cellular protein at the translational level by a retrovirus
Abstract
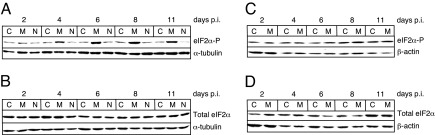
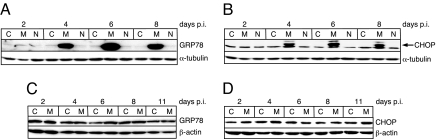
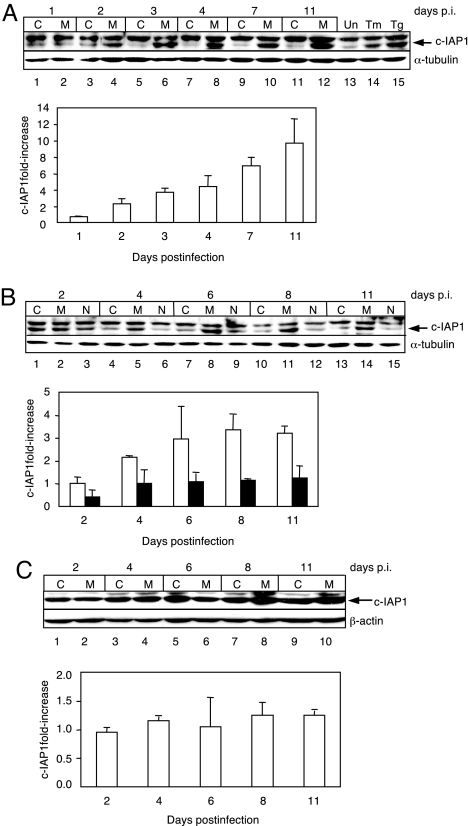
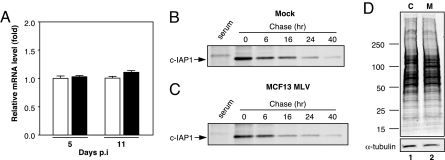
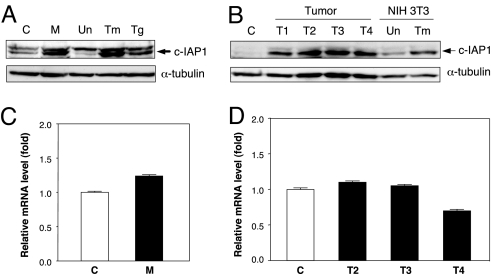
Mink cell focus-forming (MCF) murine leukemia viruses (MLVs) are the etiologic agent of thymic lymphoma in mice. We have observed previously that superinfection by MCF13 MLV of certain cell types, such as preleukemic thymic lymphocytes and cultured mink epithelial cells, results in the accumulation of the viral envelope precursor polyprotein, leading to the induction of endoplasmic reticulum (ER) stress. In this study, we demonstrate that the induction of ER stress by MCF13 MLV infection results in an increase in the phosphorylation of the alpha-subunit of eukaryotic initiation factor 2. In cells in which this occurs, we have detected an up-regulation of the cellular inhibitor of apoptosis protein 1 (c-IAP1). The results of real-time RT-PCR quantification of message levels and protein turnover assays indicate that up-regulation of c-IAP1 occurs at the translational level. Elevation of c-IAP1 levels at a posttranscriptional step was detectable in MCF13 MLV-induced thymic lymphomas and chronically infected mink epithelial cells. The ability of a simple retrovirus to regulate cellular gene expression at the translational level may be an important mechanism that contributes to pathogenesis.
Conflict of interest statement
The authors declare no conflict of interest.
Figures
Similar articles
-
Mink cell focus-forming murine leukemia virus killing of mink cells involves apoptosis and superinfection.J Virol. 2001 Jul;75(13):6007-15. doi: 10.1128/JVI.75.13.6007-6015.2001. J Virol. 2001. PMID: 11390602 Free PMC article.
-
Expression of murine leukemia virus envelope protein is sufficient for the induction of apoptosis.J Virol. 2008 Mar;82(5):2586-9. doi: 10.1128/JVI.02291-07. Epub 2007 Dec 12. J Virol. 2008. PMID: 18077710 Free PMC article.
-
Differential cell killing by lymphomagenic murine leukemia viruses occurs independently of p53 activation and mitochondrial damage.J Virol. 2004 May;78(10):5088-96. doi: 10.1128/jvi.78.10.5088-5096.2004. J Virol. 2004. PMID: 15113890 Free PMC article.
-
Leukemogenesis by Moloney murine leukemia virus: a multistep process.Trends Microbiol. 1997 Feb;5(2):74-82. doi: 10.1016/S0966-842X(96)10076-7. Trends Microbiol. 1997. PMID: 9108934 Review.
-
Experimental models and conceptual approaches to studies of lymphomas and leukemia: etiology, biology, and control.Semin Hematol. 1978 Apr;15(2):95-115. Semin Hematol. 1978. PMID: 206975 Review. No abstract available.
Cited by
-
NADPH oxidase pathway is involved in aortic contraction induced by A3 adenosine receptor in mice.J Pharmacol Exp Ther. 2011 Aug;338(2):711-7. doi: 10.1124/jpet.111.180828. Epub 2011 May 23. J Pharmacol Exp Ther. 2011. PMID: 21606175 Free PMC article.
-
Engineering of chaperone systems and of the unfolded protein response.Cytotechnology. 2008 Jul;57(3):207-31. doi: 10.1007/s10616-008-9157-9. Epub 2008 Aug 15. Cytotechnology. 2008. PMID: 19003179 Free PMC article.
-
Inhibition of NF-kappaB signaling by quinacrine is cytotoxic to human colon carcinoma cell lines and is synergistic in combination with tumor necrosis factor-related apoptosis-inducing ligand (TRAIL) or oxaliplatin.J Biol Chem. 2010 Jun 18;285(25):19162-72. doi: 10.1074/jbc.M109.091645. Epub 2010 Apr 27. J Biol Chem. 2010. PMID: 20424169 Free PMC article.
-
A1 adenosine receptor negatively modulates coronary reactive hyperemia via counteracting A2A-mediated H2O2 production and KATP opening in isolated mouse hearts.Am J Physiol Heart Circ Physiol. 2013 Dec 1;305(11):H1668-79. doi: 10.1152/ajpheart.00495.2013. Epub 2013 Sep 16. Am J Physiol Heart Circ Physiol. 2013. PMID: 24043252 Free PMC article.
-
NF45 functions as an IRES trans-acting factor that is required for translation of cIAP1 during the unfolded protein response.Cell Death Differ. 2010 Apr;17(4):719-29. doi: 10.1038/cdd.2009.164. Epub 2009 Nov 6. Cell Death Differ. 2010. PMID: 19893574 Free PMC article.
References
-
- Jonkers J, Berns A. Retroviral insertional mutagenesis as a strategy to identify cancer genes. Biochim Biophys Acta. 1996;1287:29–57. - PubMed
Publication types
MeSH terms
Substances
Grants and funding
LinkOut - more resources
Full Text Sources
Molecular Biology Databases
Research Materials
