. 2008 Jun 17;105(24):8215-20.
doi: 10.1073/pnas.0708100105. Epub 2008 Mar 31.

Starvation-dependent differential stress resistance protects normal but not cancer cells against high-dose chemotherapy

Affiliations

Starvation-dependent differential stress resistance protects normal but not cancer cells against high-dose chemotherapy

Lizzia Raffaghello et al. Proc Natl Acad Sci U S A. .

Abstract

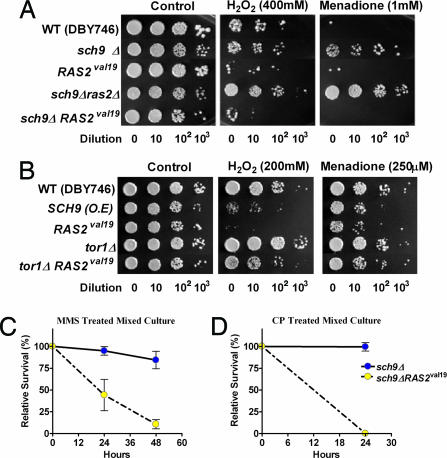
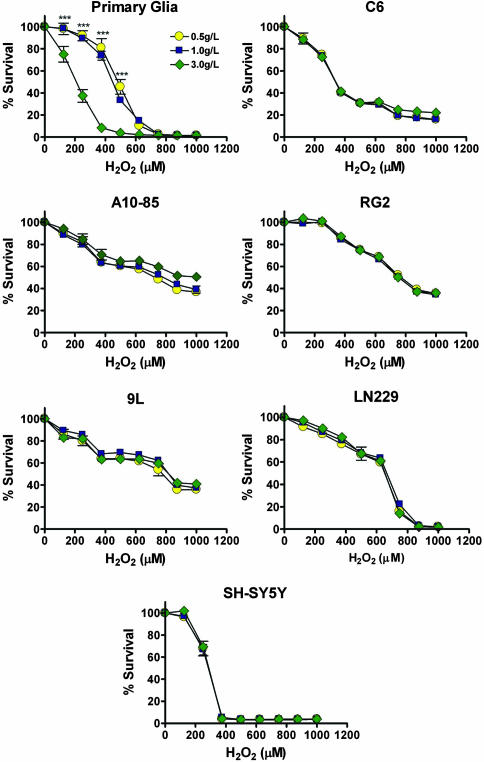
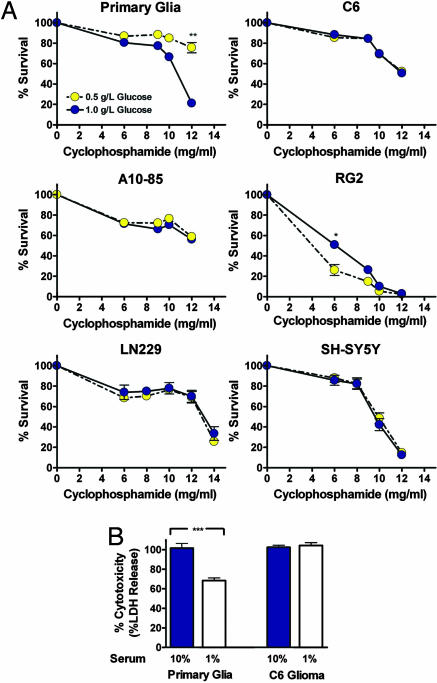
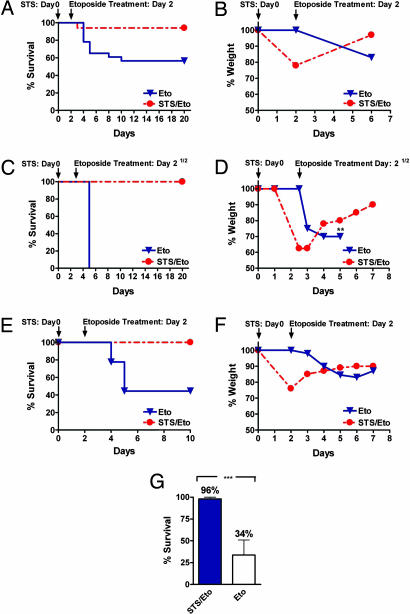
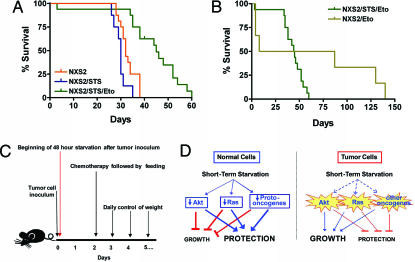
Strategies to treat cancer have focused primarily on the killing of tumor cells. Here, we describe a differential stress resistance (DSR) method that focuses instead on protecting the organism but not cancer cells against chemotherapy. Short-term starved S. cerevisiae or cells lacking proto-oncogene homologs were up to 1,000 times better protected against oxidative stress or chemotherapy drugs than cells expressing the oncogene homolog Ras2(val19). Low-glucose or low-serum media also protected primary glial cells but not six different rat and human glioma and neuroblastoma cancer cell lines against hydrogen peroxide or the chemotherapy drug/pro-oxidant cyclophosphamide. Finally, short-term starvation provided complete protection to mice but not to injected neuroblastoma cells against a high dose of the chemotherapy drug/pro-oxidant etoposide. These studies describe a starvation-based DSR strategy to enhance the efficacy of chemotherapy and suggest that specific agents among those that promote oxidative stress and DNA damage have the potential to maximize the differential toxicity to normal and cancer cells.


Conflict of interest statement

The authors declare no conflict of interest.

Figures

Fig. 1.
Fig. 1.
DSR against oxidants and genotoxins in yeast. (A and B) Survival of nondividing (day 3) STS-treated yeast cells deficient in Sch9 and/or Ras2 (sch9Δ and sch9Δ ras2Δ), and cells overexpressing Sch9 or expressing constitutively active RAS2 val19 (SCH9, RAS2val19, sch9Δ RAS2val19, and tor1Δ RAS2val19) after treatment with H2O2 (30 min) or menadione (60 min). At day 3, cells were treated with either H2O2 for 30 min or menadione for 60 min. Serial dilution (10-, 102-, and 103-fold dilutions, respectively, in the spots from left to right) of the treated cultures was spotted onto YPD plates and incubated for 2–3 days at 30°C (see detailed methods in SI Materials and Methods). This experiment was repeated at least three times with similar results. A representative experiment is shown. (C and D) Differential stress resistance (DSR) to chronic CP and methylmethane sulfonate (MMS) treatments in mixed yeast cultures: sch9Δ and sch9Δ RAS2val19. To model the mixture of normal and tumor cells in mammalian cancer, sch9Δ and sch9Δ RAS2val19 were mixed in the same flask and incubated for 2 h at 30°C with shaking. The initial sch9Δ:sch9Δ RAS2val19 ratio, measured by growth on selective media, was 25:1. Mixed cultures were then treated with either CP (0.1 M) or MMS (0.01%). Viability was measured after 24–48 h by plating onto appropriate selective media that allows the distinction of the two strains. Data from three independent experiments are shown as means ± SD.
Fig. 2.
Fig. 2.
In vitro DSR to H2O2 treatment. Primary rat glial cells, rat glioma cell lines (C6, A10-85, RG2, and 9L), a human glioma cell line (LN229), and a human neuroblastoma cell line (SH-SY5Y) were tested for glucose restriction-induced DSR. Cells were incubated in low glucose (0.5 g/liter, STS), normal glucose (1.0 g/liter), or high glucose (3.0g/liter), supplemented with 1% serum, for 24 h. Viability (MTT assay) was determined after a 24-h treatment with 0–1,000 μM H2O2. All data are presented as means ± SD. P values were calculated with Student's t test (*, P < 0.05; **, P < 0.01; ***, P < 0.001; of 0.5 and 1.0 g/liter vs. 3.0 g/liter glucose).
Fig. 3.
Fig. 3.
In vitro DSR to CP treatments. Primary rat glial cells, rat glioma cell lines (C6, A10-85, and RG2), a human glioma cell line (LN229), and a human neuroblastoma cell line (SH-SY5Y) were tested. (A) Glucose restriction-induced DSR. Cells were incubated in either low glucose (0.5 g/liter, STS) or normal glucose media (1.0 g/liter), supplemented with 1% serum, for 24 h. Cells were then treated with CP (6–12 mg/ml) for 10 h, and viability was determined (MTT assay) (n = 9). (B) Serum restriction-induced DSR. Cells were incubated in medium containing either 1% (STS) or 10% serum for 24 h, followed by a single CP treatment (15 mg/ml) for 10 h. Cytotoxicity was determined by the LDH assay (n = 12). All data are presented as means ± SD. P values were calculated with Student's t test (*, P < 0.05; **, P < 0.01; ***, P < 0.001).
Fig. 4.
Fig. 4.
Short-term starvation protects against high-dose chemotherapy in vivo. (A) A/J mice were treated (i.v.) with 80 mg/kg etoposide with (STS/Eto, n = 17) or without (Eto, n = 23) a prior 48-h starvation (STS). (B) Percent weight loss (a measure of toxicity) after etoposide treatment in STS-treated (n = 17) or untreated (n = 23) A/J mice. (C) CD-1 mice were treated (i.v.) with 110 mg/kg etoposide with (STS/Eto, n = 5) or without (Eto, n = 5) a 60-h prior starvation. (D) Percent weight loss after etoposide treatment in STS-treated (n = 5) or untreated (n = 5) CD-1 mice. Asterisks indicate the day at which all mice died of toxicity. (E) Athymic (Nude-nu) mice were treated (i.v.) with 100 mg/kg etoposide with (STS/Eto, n = 6) or without (Eto, n = 9) a 48-h prior starvation. (F) Percent weight loss after etoposide treatment in the treated (STS/Eto, n = 6) or untreated (Eto, n = 9) athymic (Nude-nu) mice. (G) Comparison of survival of all of the mice that were either prestarved (STS/Eto) or not (Eto) before etoposide injection. The survival of all STS-treated (n = 28) and untreated (n = 37) mice from all genetic backgrounds above (A/J, CD1, and Nude-nu) has been averaged (***, P < 0.05).
Fig. 5.
Fig. 5.
DSR in mice. (A and B) Survival of neuroblastoma (NXS2)-bearing mice. All mice were inoculated (i.v.) with 200,000 NXS2 cells per mouse. The different groups were treated as follows: NXS2 (control group, 16 mice), i.v. inoculation with NSX2 tumor cells on time 0; NXS2/STS (STS, 8 mice), i.v. inoculation with NSX2 tumor cells at time 0 followed by a 48-h starvation; NXS2/STS/Eto (STS/Eto, 16 mice), i.v. inoculation with NSX2 tumor cells at time 0, followed by a 48-h starvation, followed by an i.v. injection with 80 mg/kg etoposide and feeding at 48 h; NXS2/Eto (Eto, 6 mice, two deaths caused by the injection procedure), i.v. inoculation with NSX2 tumor cells at time 0, followed by an i.v. injection of 80 mg/kg etoposide at 48 h. The survival period of the NXS2 (control) and NXS2/STS/Eto groups was significantly different (P < 0.001), whereas that of the NXS2 (control) and Eto groups was not (P = 0.20). In addition, the survival periods of the NXS2/STS/Eto and NXS2/Eto groups were not significantly different (P = 0.12). (C) Procedure for the in vivo experiment. (D) Model for DSR in response to STS. In normal cells, downstream elements of the IGF1 and other growth factor pathways, including the Akt, Ras, and other proto-oncogenes, are down-regulated in response to the reduction in growth factors caused by starvation. This down-regulation blocks/reduces growth and promotes protection to chemotherapy. By contrast, oncogenic mutations render tumor cells less responsive to STS because of their independence from growth signals. Therefore, cancer cells fail to or only partially respond to starvation conditions and continue to promote growth instead of protection against oxidative stress and high-dose chemotherapy.

Comment in

Similar articles

Cited by

References

    1. Longo VD, Gralla EB, Valentine JS. J Biol Chem. 1996;271:12275–12280. - PubMed
    1. Fabrizio P, Pozza F, Pletcher SD, Gendron CM, Longo VD. Science. 2001;292:288–290. - PubMed
    1. Holzenberger M, Dupont J, Ducos B, Leneuve P, Géloën A, Even PC, Cervera P, Le Bouc Y. Nature. 2003;421:182–187. - PubMed
    1. Lithgow GJ, White TM, Hinerfeld DA, Johnson TE. J Gerontol. 1994;49:B270–B276. - PubMed
    1. Longo VD, Finch CE. Science. 2003;299:1342–1346. - PubMed

Publication types

MeSH terms