Comparative Study
. 2008 Apr;27(7):1585-95.
doi: 10.1111/j.1460-9568.2008.06119.x.

ADAM2 promotes migration of neuroblasts in the rostral migratory stream to the olfactory bulb

Affiliations
Comparative Study

ADAM2 promotes migration of neuroblasts in the rostral migratory stream to the olfactory bulb

Shin-Ichi Murase et al. Eur J Neurosci. 2008 Apr.

Abstract

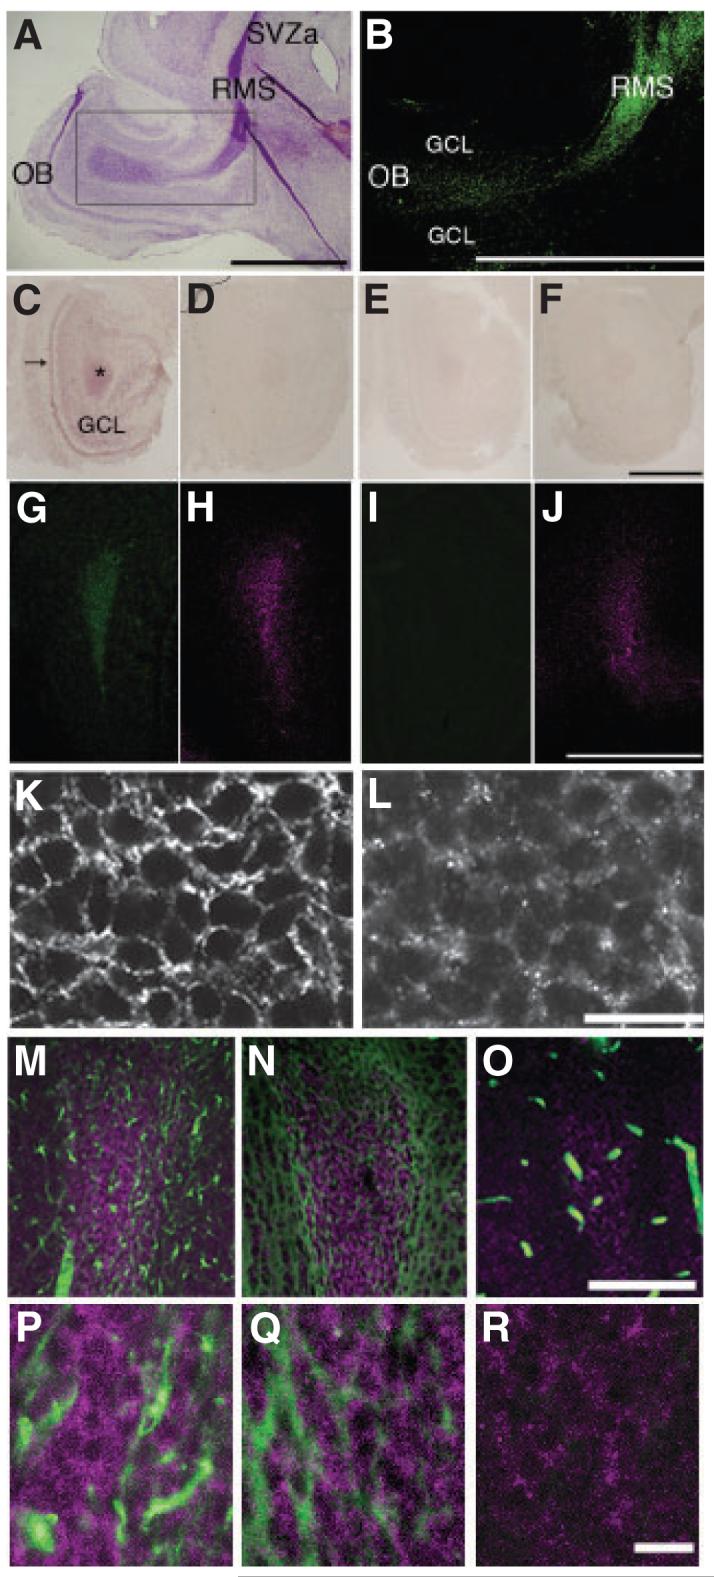
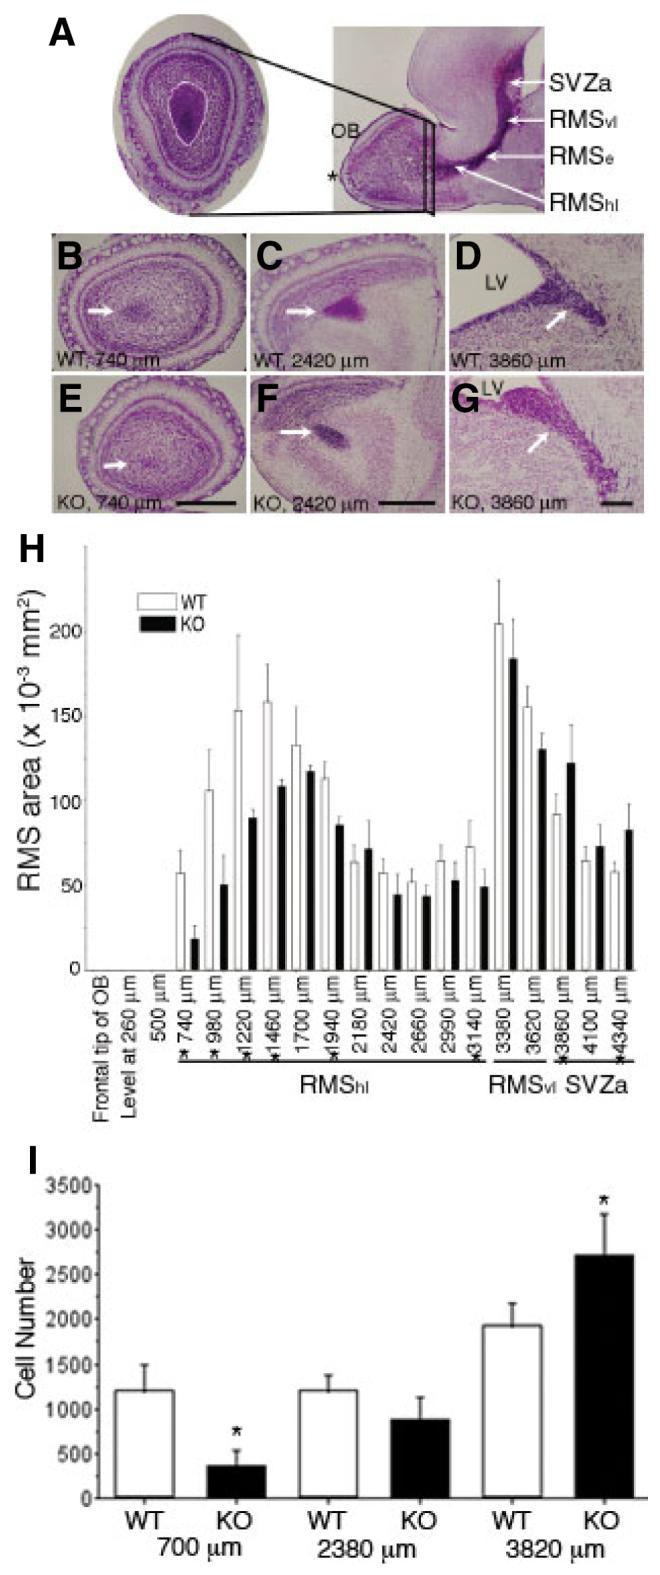
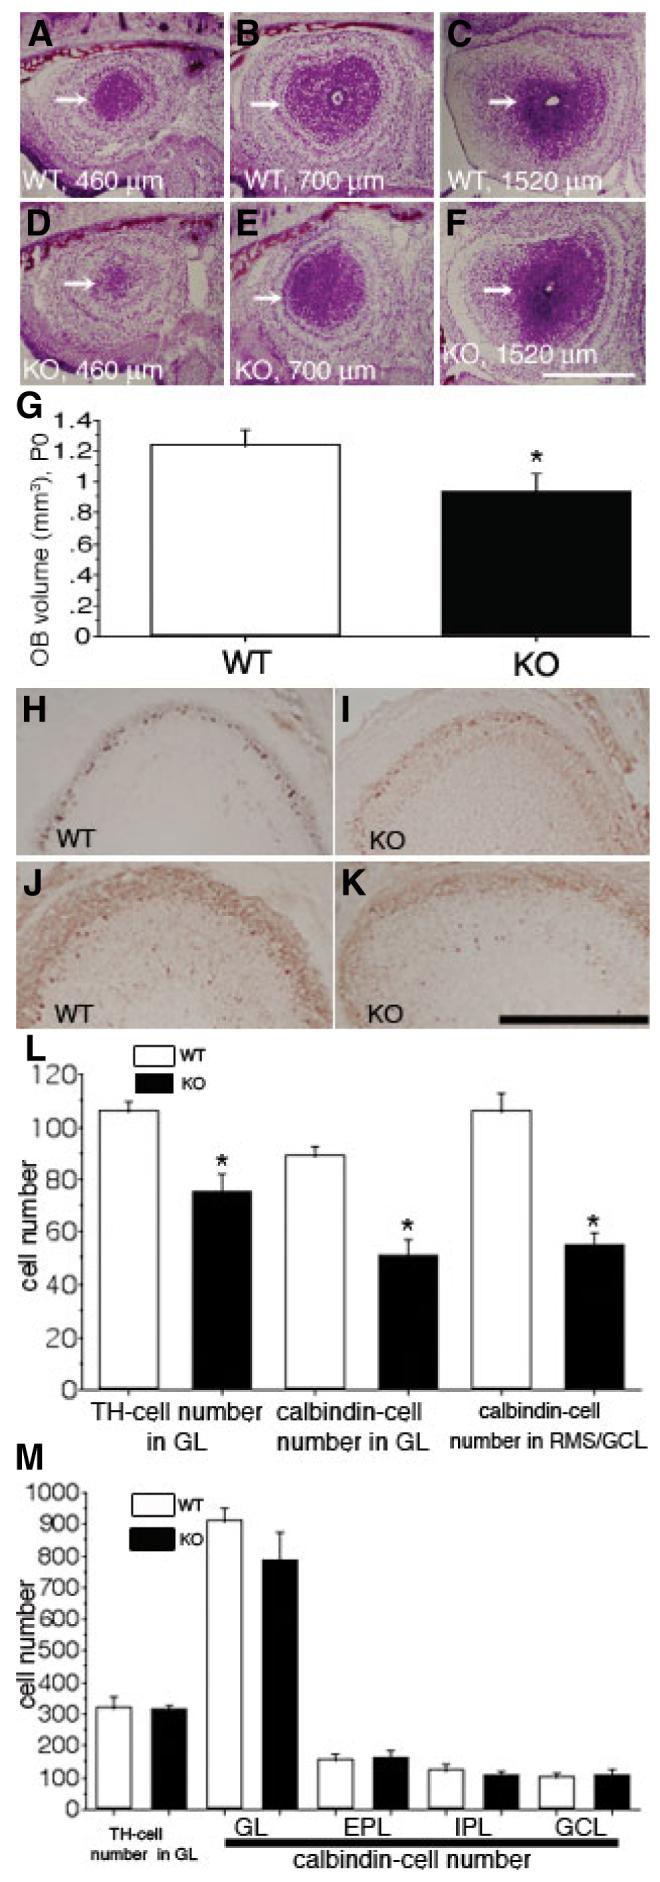
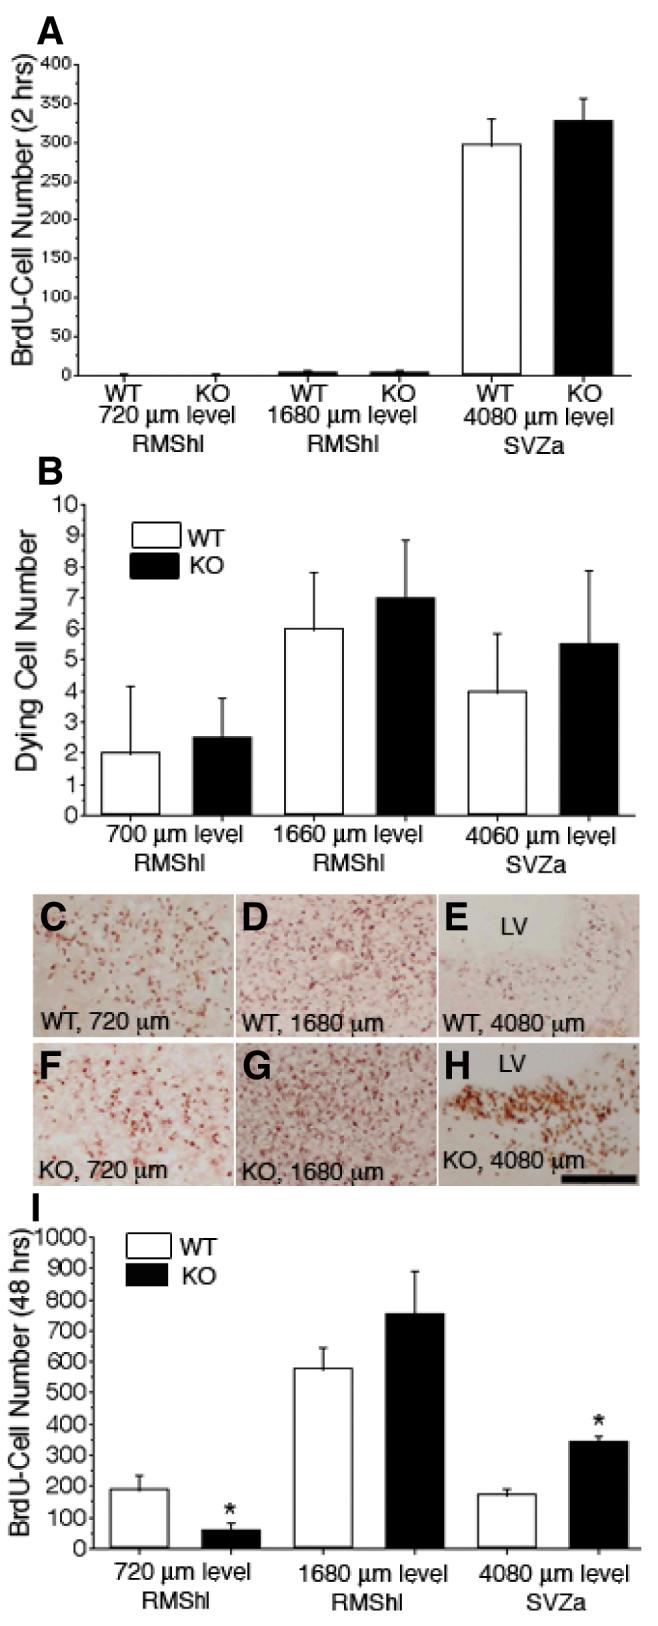
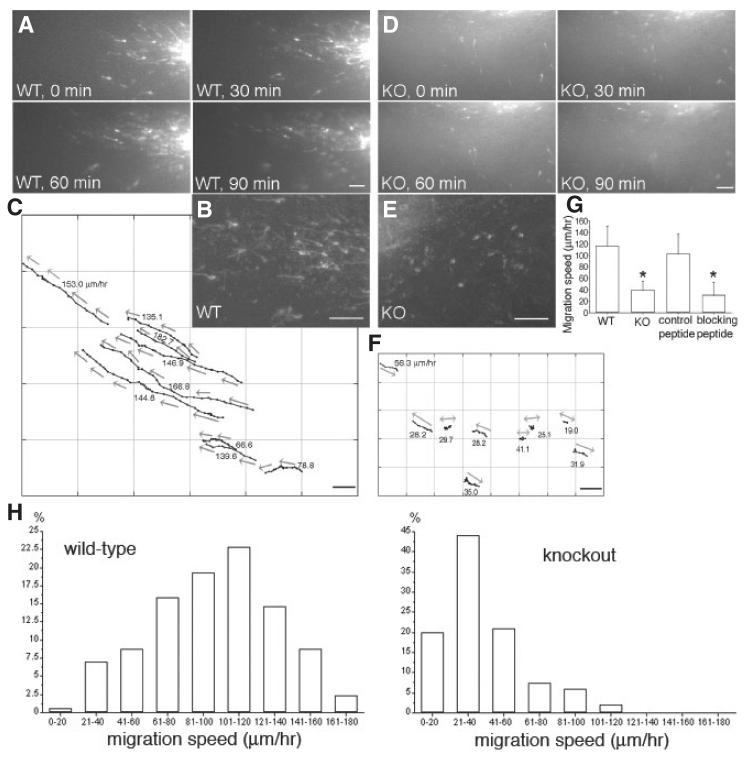
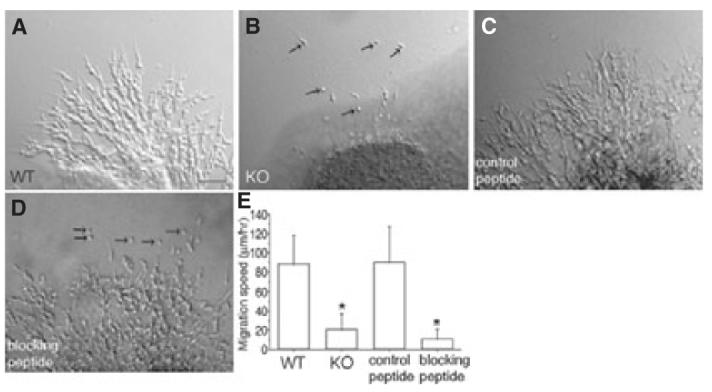
Neuroblasts migrate from the subventricular zone along the rostral migratory stream (RMS) to the olfactory bulb (OB). While the migration occurs by movement over other cells, the molecular mechanisms are poorly understood. We have found that ADAM2 (a disintegrin and metalloprotease 2) is expressed in migrating RMS neuroblasts and functions in their migration. The brains from ADAM2 knockout (KO) mice showed a smaller OB than that seen in wild-type (WT) mice at postnatal day 0. In addition, the RMS in ADAM2 KO mice appeared thinner and less voluminous in its rostral part and thicker in its caudal part. Estimates of migration in vivo using bromodeoxyuridine labeling revealed that neuroblasts from KO mice show a decreased migration rate compared with those from WT mice. Direct assays of migration by imaging living slices also showed a decreased migration speed and loss of directionality in the KO mice. This phenotype was similar to that seen in RMS containing slices from WT mice exposed to a peptide that mimicked the disintegrin loop of ADAM2. Finally, RMS explants from KO or WT mice that were cultured in Matrigel also revealed striking differences. The cells migrating out of explants from WT mice showed robust cell-cell interactions. In contrast, fewer cells migrated out of explants from ADAM2 KO mice, and those that did were largely dispersed and their migration inhibited. These experiments suggest that ADAM2 contributes to RMS migration, possibly through cell-cell interactions that mediate the rapid migration of the neuroblasts to their endpoint.


Figures

Fig. 1
Fig. 1
ADAM2 expression in the rostral migratory stream. (A) Nissl staining of a sagittal section from a postnatal day 5 (P5) mouse forebrain. The rostral migratory stream (RMS), which is characterized by high cellular density and intense Nissl staining, begins at the anterior portion of the subventricular zone (SVZa) and ends at the center of the olfactory bulb (OB). (B) ADAM2 immunoreactivity in the RMS. This is the adjacent section to that shown in (A, rectangular area), stained with 9D2.2, an anti-ADAM2 antibody. (C) ADAM2 mRNA expression in a frontal section (horizontal limb region; see legend for Fig. 2) from a P10 wild-type (WT) OB. (D) An adjacent section to that in (C) incubated with ADAM2 sense probe. (E) A frontal section of the OB from P10 ADAM2 knockout (KO) mouse incubated with ADAM2 antisense probe. (F) A section adjacent to (E) was incubated with the sense probe. (G and H) Frontal sections (vertical limb region; see Fig. 2 legend) of the OB from P10 WT mice were incubated with 9D2.2, anti-ADAM2 (green) and anti-polysialic acid (PSA) antibodies (magenta), respectively. (I and J) Frontal sections of the OB from P10 ADAM2 KO were incubated with anti-ADAM2 (green) and anti-PSA antibodies (magenta). GCL, granule cell layer. Scale bars: 500 μm. (K and L) Increased magnification of frontal sections from the WT RMS co-stained with anti-PSA and anti-ADAM2 (AB19030) antibodies. Scale bar: 10 μm. (M) Frontal section of the RMS from P21 WT mice co-stained with anti-glial fibrillary acidic protein (GFAP; green) and anti-ADAM2 antibodies (AB19030, magenta). (N) Frontal section of the RMS from P21 WT mice co-stained with anti-tenascin-C (green) and anti-ADAM2 antibodies (AB19030, magenta). (O) Frontal section of the RMS from P21 WT mice co-stained with anti-neurofilament monoclonal antibody (green) and anti-ADAM2 antibody (AB19030, magenta). Blood vessels containing IgG showed nonspecific staining for the secondary anti-mouse IgG antibody, but no specific staining for neurofilaments. Scale bar: 100 μm. (P) High magnification of (M). (Q) High magnification of (N). (R) High magnification of (O). Scale bar: 10 μm.
Fig. 2
Fig. 2
Altered histoarchitecture of the rostral migratory stream (RMS) of ADAM2 knockout (KO) mice (A) The RMS is distinguished by the intense Nissl staining in this parasagittal view of a P10 mouse forebrain (right). The asterisk indicates the frontal tip of the olfactory bulb (OB). The area of the RMS from wild-type (WT) and KO P10 mice was estimated from 20-μm-thick Nissl-stained, serial frontal sections derived from the frontal tip of the OB to the anterior part of the subventricular zone (SVZa; left). Areas of the RMS (demarcated by the white line) were measured on these frontal sections at 240 μm intervals. The RMS starts at the SVZa, then descends as the vertical limb (RMSvl), and finally becomes the horizontal limb (RMShl) near the OB. The elbow of the RMS (RMSe; Pencea & Luskin, 2003) is the junction between the RMSvl and the RMShl. (B—D) WT. Representative sections at the levels of 740 μm (end portion of the RMS), 2420 μm (RMShl, which denotes the horizontal limb region of the RMS near the OB) and 3860 μm (SVZa) from the frontal tip of the OB are shown. The RMS or SVZa (arrows) are characterized by a high cellular density at the center of the OB, or adjacent to the lateral ventricle (LV), respectively. (E—G) KO. Sections of the same level shown in (B—D). In each photograph (B—G), the right side is toward the dorsal part of the forebrain. Scale bar: 500 μm. (H) The RMS areas from the WT and the KO were compared between the same levels from the frontal tip of the OB to the SVZa. Each value represents the mean ± SD (N = 4 from four mice). The differences between the area of WT and KO at the levels (indicated by asterisks) were significant (P < 0.05). (I) The number of polysialic acid (PSA)-positive cells was counted in the RMS of WT and KO mice, and compared at the same distance from the tip of the OB to the SVZa. Each value represents the mean ± SD (N = 4 from four mice). The differences in cell number at the 700 μm and 3820 μm levels are significant (indicated by asterisks, P < 0.05).
Fig. 3
Fig. 3
ADAM2 affects the size of the olfactory bulb (OB) at an early developmental stage. (A—C) Wild-type (WT) mice at P0. Representative, Nissl-stained sections at the level of 460 μm, 700 μm and 1520 μm from the frontal tip of the OB are shown; rostral migratory stream (RMS)—granular cell layer (GCL) (arrows). (D—F) Knockout (KO) mice at P0. Sections are at the same levels shown in (A—C). (G) The OB volume from the WT and the KO were compared. Each value represents the mean ± SD (N = 5 from five mice); the difference in volume of the OB between WT and KO is=significant (indicated by asterisk, P < 0.05). (H and I) WT (H) and KO (I) OB from P0 mice stained with an anti-tyrosine hydroxylase (TH) antibody. (J and K) WT (J) and KO (K) OB from P0 mice stained with an anti-calbindin antibody. (L) The difference in the numbers of TH- and calbindin-positive cells from the WT and KO mice at P0 are significant (indicated by asterisks, P < 0.05); each value represents the mean ± SD (N = 4 from four mice). (M) The numbers of TH-and calbindin-positive cells from the WT and KO mice at P30 were compared. Each value represents the mean ± SD (N = 4 from four mice), and is not statistically significantly different. EPL, external plexiform layer; GL, glomerular layer; IPL, internal plexiform layer. Scale bar: 500 μm (A—F); 250 μm (H—K).
Fig. 4
Fig. 4
Delayed tangential migration in the ADAM2 knockout (KO) rostral migratory stream (RMS). P10 postnates were injected with bromodeoxyuridine (BrdU), killed 2 h later, and then fixed for BrdU and stained with an anti-single-stranded DNA antibody to evaluate proliferative activity and cell death of neuroblasts, respectively. Neuroblasts migration in vivo was estimated in P8 postnatal mice by injecting BrdU, killing 48 h later and fixing for BrdU immunohistochemistry. In both wild-type (WT) and KO P10 mice, serial frontal sections (20 μm thickness each) from the frontal tip of the olfactory bulb (OB) to the anterior part of the subventricular zone (SVZa) were collected and stained with an anti-BrdU antibody or anti-single-stranded DNA antibody. The number of BrdU-positive cells (BrdU-cells) was evaluated on sections at 240 μm intervals. In each image, the right side is toward the dorsal part of the forebrain. (A) Neuroblast proliferative activity was estimated from the number of BrdU-cells (2 h after injection) from WT and KO mice at the same distance between the frontal tip of the OB and the SVZa. Each value represents the mean ± SD (N = 4 from four mice); there are no statistical differences (P < 0.05). (B) The number of dying neuroblasts in the RMS from WT and KO mice was compared at the same distance between the frontal tip of the OB and the SVZa. Each value represents the mean ± SD (N = 4 from four mice); there were no statistically significant differences (P <= 0.05). (C—E) WT. Representative sections at the end portion of the RMS (720 μm level), horizontal limb of the RMS (RMShl; 1680 μm level) and SVZa (4080 μm level) from the frontal tip of the OB are shown. BrdU-cells (48 h after injection) were concentrated in the RMS. At the SVZa level in (E), few BrdU-cells are seen. (F—H) KO. Sections are at the same levels shown in (C—E). In (F), the BrdU-cell density (48 h after injection) is low compared with WT (C). At the 1680 μm level, the section from the KO mice shows significant numbers of BrdU-cells (G), and at the SVZa level, many BrdU-cells are seen (H). (I) The number of BrdU-cells (48 h after injection) from WT and KO mice were compared at the same levels from the frontal tip of the OB to the SVZa. At the rostral part of the RMS, the KO mice show fewer BrdU-cells than that from WT mice; however, at the mid portion between the RMShl and the SVZa, KO mice have more cells than WT. Each value represents the mean ± SD (N = 4 from four mice); the differences at the 720 μm and 4080 μm levels are significant (indicated by asterisks, P < 0.05). LV, lateral ventricle; RMShl, horizontal limb region of the RMS. Scale bar: 500 μm.
Fig. 5
Fig. 5
Disturbed tangential migration of ADAM2 knockout (KO) neuroblasts. Brain slices from a P10 mouse [wild-type (WT) or KO] were labeled with DiI and their migration recorded for 3–4 h. (A) Time-lapse sequence of WT neuroblasts migrating from the anterior part of the subventricular zone (SVZa; right bottom corner) toward the olfactory bulb (OB; left upper corner). The interval between each image is 30 min. See supplementary Video S1. (B) Higher magnification image of DiI-labeled WT neuroblasts migrating toward the OB. (C) Graphical representation of the migration of the neuroblasts in (A). Each point represents the position of the cell body at 5-min intervals. Arrows show the direction of neuroblast migration. (D) Time-lapse sequence of ADAM2 KO neuroblasts migrating from the SVZa (right) toward the OB (left). The interval between each image is 30 min. See supplementary Video S2. (E) Higher magnification image of DiI-labeled ADAM2 KO neuroblasts. (F) Graphical representation of the migration of the ADAM2 KO neuroblasts in (D). Each point represents the position of the cell body at 5-min intervals. Neuroblasts without a clear direction were marked with double-headed arrows. (G) Reduced migration rate of RMS neuroblasts from ADAM2 KO mice or in the presence of a function-blocking ADAM2 peptide. Each value is the mean ± SD. WT (N = 46, five slices from five mice), ADAM2 KO (N = 36, five slices from five mice), control peptide (N = 31, four slices from four mice), blocking peptide (N = 30, five slices from five mice). Statistically significant data (P < 0.05) are indicated by asterisks. Scale bars: 50 μm. (H) Distribution of migration speeds of the RMS neuroblasts from WT (N = 171, six slices from six mice) and KO (N = 202, six slices from six mice)mice.
Fig. 6
Fig. 6
Perturbed chain migration of neuroblasts in explant cultures from ADAM2 knockout (KO) or wild-type (WT) mice treated with an ADAM2 function-blocking peptide. Rostral migratory stream (RMS) tissue from ADAM2 KO or WT mice was cultured in Matrigel. The tissue from WT mice was cultured either in the absence or presence of adhesion-blocking peptides. The migration was analysed from differential interference contrast images. For the peptide-blocking experiments (C and D), the explants were cultured for 24 h before addition of the peptides. (A) Neuroblasts migrating away from an RMS explant from WT mice embedded in Matrigel. See supplementary Video S4. Scale bar: 50 μm. (B) Cells from the RMS of KO mice migrate as single cells (arrows). See supplementary Video S5. (C) A peptide whose sequence contains the scrambled amino acids in the ADAM2 disintegrin loop was added to Matrigel cultures of the RMS from WT mice, as a control peptide. See supplementary Video S6. (D) Function-blocking peptide whose sequence corresponds to the ADAM2 disintegrin loop was added into WT Matrigel culture. Isolated neuroblasts (arrows) are seen. See supplementary Video S7. (E) Reduced net migration rate of RMS neuroblasts either from ADAM2 KO, or from WT mice and incubated with a function-blocking ADAM2 peptide. WT (N = 34, three explants from three mice), ADAM2 KO (N = 42, three explants from three mice), control peptide (N = 37, three explants from three mice), blocking peptide (N = 37, three explants from three mice). The differences in migration speed between WT and KO, and control peptide and blocking peptide are significant (P < 0.05; indicated by asterisks).

References

    1. Altman J. Autoradiographic and histological studies of postnatal neurogenesis. IV. Cell proliferation and migration in the anterior forebrain, with special reference to persisting neurogenesis in the olfactory bulb. J. Comp. Neurol. 1969;137:433–457. - PubMed
    1. Aufderheide E, Ekblom P. Tenascin during gut development: appearance in the mesenchyme, shift in molecular forms, and dependence on epithelial—mesenchymal interactions. J. Cell Biol. 1988;107:2341–2349. - PMC - PubMed
    1. Bastianelli E, Pochet R. Calmodulin, calbindin-D28k, calretinin and neurocalcin in rat olfactory bulb during postnatal development. Brain Res. Dev. Brain Res. 1995;87:224–227. - PubMed
    1. Bayer SA. 3H-thymidine-radiographic studies of neurogenesis in the rat olfactory bulb. Exp. Brain Res. 1983;50:329–340. - PubMed
    1. Belvindrah R, Hankel S, Walker J, Patton BL, Muller U. Beta1 integrins control the formation of cell chains in the adult rostral migratory stream. J. Neurosci. 2007;27:2704–2717. - PMC - PubMed

Publication types

MeSH terms