. 2008 May 30;283(22):15078-88.
doi: 10.1074/jbc.M707941200. Epub 2008 Apr 1.

Bioluminescence resonance energy transfer assays reveal ligand-specific conformational changes within preformed signaling complexes containing delta-opioid receptors and heterotrimeric G proteins

Affiliations

Bioluminescence resonance energy transfer assays reveal ligand-specific conformational changes within preformed signaling complexes containing delta-opioid receptors and heterotrimeric G proteins

Nicolas Audet et al. J Biol Chem. .

Abstract

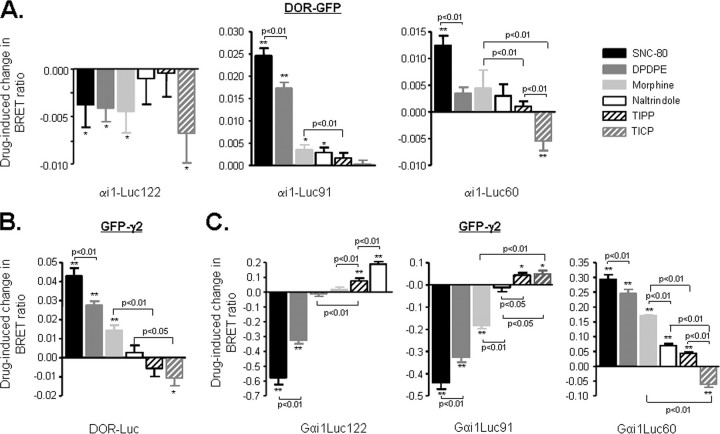
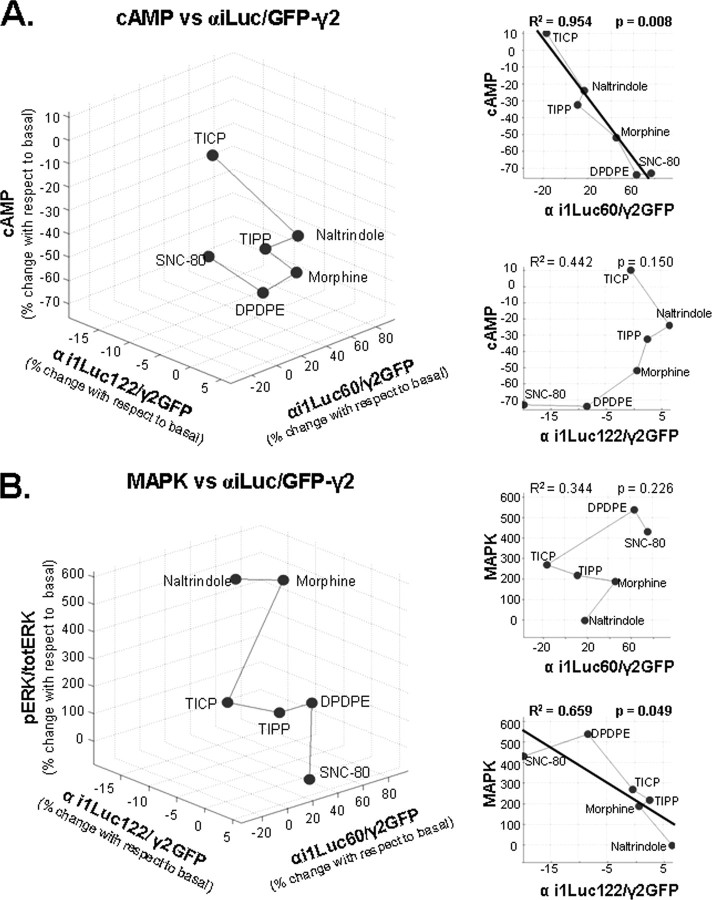
Heptahelical receptors communicate extracellular information to the cytosolic compartment by binding an extensive variety of ligands. They do so through conformational changes that propagate to intracellular signaling partners as the receptor switches from a resting to an active conformation. This active state has been classically considered unique and responsible for regulation of all signaling pathways controlled by a receptor. However, recent functional studies have challenged this notion and called for a paradigm where receptors would exist in more than one signaling conformation. This study used bioluminescence resonance energy transfer assays in combination with ligands of different functional profiles to provide in vivo physical evidence of conformational diversity of delta-opioid receptors (DORs). DORs and alpha(i1)beta(1)gamma(2) G protein subunits were tagged with Luc or green fluorescent protein to produce bioluminescence resonance energy transfer pairs that allowed monitoring DOR-G protein interactions from different vantage points. Results showed that DORs and heterotrimeric G proteins formed a constitutive complex that underwent structural reorganization upon ligand binding. Conformational rearrangements could not be explained by a two-state model, supporting the idea that DORs adopt ligand-specific conformations. In addition, conformational diversity encoded by the receptor was conveyed to the interaction among heterotrimeric subunits. The existence of multiple active receptor states has implications for the way we conceive specificity of signal transduction.


Figures

FIGURE 1.
FIGURE 1.
Functional responses of DOR ligands in adenylyl cyclase and ERK pathways. A, HEK293 cells expressing DOR-FLAG were treated with saturating concentrations (10 μm) of indicated ligands and cAMP accumulation assays performed in the presence of 25 μm forskolin as detailed under “Experimental Procedures.” Drug effects are expressed as percentage change with respect to the total amount of cAMP produced in the absence of ligand (percentage change in cAMP accumulation = (cAMPligand – cAMPno ligand)/cAMPno ligand × 100) and correspond to mean ± S.E. of seven experiments carried out in triplicates. B (top), HEK293 cells expressing DOR-FLAG were exposed to saturating concentrations of the indicated ligands for 5 min, following which ERK signaling was assessed by immunoblot. ERK phosphorylation was normalized to the amount of protein loaded per lane by expressing the data as phospho-ERK/total ERK ratio. Drug effects were expressed as percentage of the basal ratio (percentage of basal = ((pERK/total ERKligand)/(pERK/total ERKno ligand) × 100)) and represent mean ± S.E. of at least six experiments. B (bottom), representative immunoblots. pERK and total ERK bands observed in the presence and absence of the indicated drugs. Each drug was paired to its corresponding experimental control from the same blot. To achieve this pairing, lanes containing information not presented in the study were removed by splicing. Examples for different drugs were not necessarily all from the same blot, but they were all matched for total ERK contents and time of film exposure. Statistical analysis is detailed under “Experimental Procedures.” *, p < 0.05; **, p < 0.001.
FIGURE 2.
FIGURE 2.
Spontaneous signals generated by different BRET pairs. A, HEK 293 cells were transfected with recombinant plasmids for DOR-GFP, the indicated αi1-Luc constructs, and untagged β1γ2 subunits. Spontaneous interaction between DORs and αi1 subunits was measured by assessing net BRET values in the absence of ligand. Values correspond to mean ± S.E. of 5–9 experiments carried out in duplicates. Inset, HEK 293 cells expressing or not DOR-FLAG were transfected with αi1-Luc91β1γ2 or vector, and DORs were immunopurified as described under “Experimental Procedures.” The amount of αi1-Luc91 (∼75 kDa) or endogenous αi1 (∼39 kDa) subunits recovered with each purification product was assessed by immunoblot. Results correspond to a representative example of four independent experiments. Blots for αi1-Luc91 and endogenous αi1 were scanned from separate films. B, BRET titration assays were performed by measuring net energy transfer in HEK 293 cells transfected with increasing concentrations of DOR-GFP or CD8-GFP and a fixed amount of αi1-Luc91, in combination with untagged β1γ2 subunits. C, basal interaction between the βγ complex and DORs was assessed by measuring the spontaneous BRET signal generated by HEK 293 cells expressing GFP-γ2 and DOR-Luc in combination with untagged αi1 and β1 subunits. Interaction between the βγ complex and αi1 subunits was assessed by co-transfecting αi1-Luc60, αi1-Luc91, or αi1-Luc122 with GFP-γ2, β1 subunits, and DOR-FLAG into HEK 293 cells. Values correspond to mean ± S.E. of 4–9 experiments carried out in duplicates. Inset, HEK 293 cells expressing or not DOR-FLAG were transfected with αi1β1γ2 or vector, and DORs were immunopurified as described under “Experimental Procedures.” The amount of endogenous or overexpressed β1(∼32 kDa) subunits recovered with each purification product was assessed by immunoblot. Results correspond to a representative example of four independent experiments. D, BRET titration assays were performed by measuring net energy transfer in HEK 293 cells transfected with increasing amounts of GFP-γ2 and a fixed amount of DOR-Luc or CD8-Luc, in combination with untagged αi1 and β1 subunits.
FIGURE 3.
FIGURE 3.
BRET changes promoted by DPDPE and TICP are consistent with conformational reorganization of preformed DOR ·αi1β1γ2 complexes. HEK 293 cells were transfected as in Fig. 2, and net BRET signals generated by DOR-GFP and specified αi1-Luc partners (A), GFP-γ2 and DOR-Luc (B), or GFP-γ2 and specified αi1-Luc constructs (C) were assessed in the presence or absence of DPDPE or TICP (10 μm; 2 min). Results were expressed as the difference between measures obtained in the presence or absence of ligand and correspond to mean ± S.E. of at least six experiments carried out in duplicates. *, p < 0.05; **, p < 0.01. D, BRET titration assays were carried out as in Fig. 2, in the presence or absence of DPDPE. BRET50 values represent the calculated ratio of donor/acceptor molecules producing 50% of the energy transfer observed at saturation. E, following transfection with DOR-FLAG, αi1-Luc91, or vector, in combination with β1γ2, cells were exposed or not to saturating concentrations of DPDPE or TICP as above. Following treatment, receptors were immunopurified, and the product was separated by SDS-PAGE. The amount of αi1-Luc91 or endogenous αi1 subunits recovered with the receptor was then assessed by immunoblot. DOR interaction with transfected or endogenous αi1 subunits was assessed by calculating the immunoreactivity ratio αi1/FLAG present in each sample. Results were expressed as percentage of basal values and represent mean ± S.E. of four experiments. Blots for αi1-Luc91 and endogenous αi1 were scanned from separate films. F, cells stably expressing DOR-FLAG were transfected with αi1β1γ2 or vector and exposed or not to DPDPE or TICP. Following DOR immunopurification, the amount of endogenous or overexpressed β1 subunits recovered with the receptor was assessed by immunoblot. Results are expressed as in E and correspond to four experiments. Blots for endogenous and overexpressed β1 subunits were scanned from separate films.
FIGURE 4.
FIGURE 4.
Ligand-promoted BRET changes are associated with G protein activation. A, HEK 293 cells were transiently transfected with the indicated BRET constructs and complementary heterotrimeric subunits and exposed to increasing concentrations of DPDPE to establish dose-response curves at each of the donor/acceptor pairs. Results are expressed as the difference of BRET ratios obtained in presence and absence of drug and are represented in the left y axis. The effect of increasing concentrations of DPDPE on G protein activation was assessed by [35S]GTPγS binding in cells transfected with FLAG-tagged-DORs. Results are expressed as percentage change with respect to basal and are represented on the right axis. B, cells expressing DOR-GFP ·αi1-Luc91 (n = 5–6) or DOR-Luc ·GFP-γ2 (n = 5–6) were exposed or not to PTX as indicated in the figure (100 ng/ml; 16 h), following which ligand-promoted BRET changes were assessed. Inset, net BRET values obtained in controls and PTX-treated cells.
FIGURE 5.
FIGURE 5.
Comparison of ligand-induced BRET changes across different donor/acceptor pairs. HEK 293 cells were transfected as detailed in previous figures, and BRET signals generated by DOR-GFP and specified αi1-Luc partners (A) were obtained in the absence and presence of the indicated ligands (10 μm; 2-min exposure). Results are expressed as the difference between measurements obtained in the presence and absence of ligand and correspond to mean ± S.E. of 5–9 experiments carried out in duplicates. BRET changes were promoted by different DOR ligands in cells expressing DOR-Luc ·GFP-γ2 (n = 5–7) (B) and in cells expressing GFP-γ2 and specified αi1-Luc partners (n = 6) (C). Note that DPDPE and TICP results that appear in Fig. 3 were included here for comparison. *, p < 0.05; **, p < 0.01.
FIGURE 6.
FIGURE 6.
Three-dimensional representations of ligand-induced changes in energy transfer at donor/acceptor pairs monitoring the interaction between αi1-Luc60 ·GFP-γ2 and αi1-Luc122 ·GFP-γ2 and ligand efficacy in cAMP assays (A) and αi1-Luc60 ·GFP-γ2 and αi1-Luc122 ·GFP-γ2, and ligand efficacy in ERK activation assays (B). Points representing different ligands were connected by a line that follows their rank order of efficacy in respective functional assays. Insets to the right, two-dimensional representations for BRET/functional data. Thick lines in two-dimensional plots illustrate linear regression for correlated pairs of data sets. Data are expressed as percentage changes with respect to values observed in absence of ligand.

References

    1. Furchgott, R. (1966) Bull. N Y Acad. Med. 42 996–1006 - PMC - PubMed
    1. Kenakin, T. (2004) Trends Pharmacol. Sci. 25 186–192 - PubMed
    1. Pineyro, G., and Archer-Lahlou, E. (2007) Cell. Signal. 19 8–19 - PubMed
    1. Urban, J. D., Clarke, W. P., von Zastrow, M., Nichols, D. E., Kobilka, B., Weinstein, H., Javitch, J. A., Roth, B. L., Christopoulos, A., Sexton, P. M., Miller, K. J., Spedding, M., and Mailman, R. B. (2007) J. Pharmacol. Exp. Ther. 320 1–13 - PubMed
    1. Berg, K. A., Maayani, S., Goldfarb, J., Scaramellini, C., Leff, P., and Clarke, W. P. (1998) Mol. Pharmacol. 54 94–104 - PubMed

Publication types

MeSH terms

LinkOut - more resources