

Signatures associated with rejection or recurrence in HER-2/neu-positive mammary tumors
- PMID: 18381452
- PMCID: PMC2478745
- DOI: 10.1158/0008-5472.CAN-07-6822
Signatures associated with rejection or recurrence in HER-2/neu-positive mammary tumors
Abstract
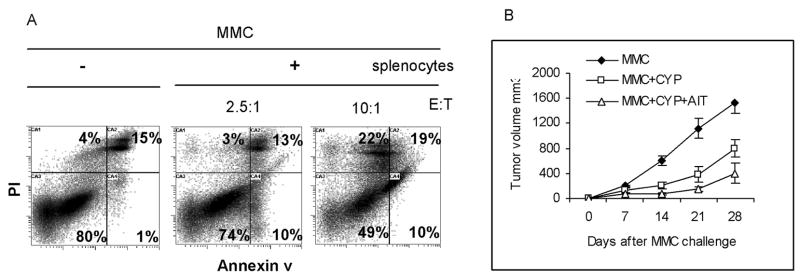
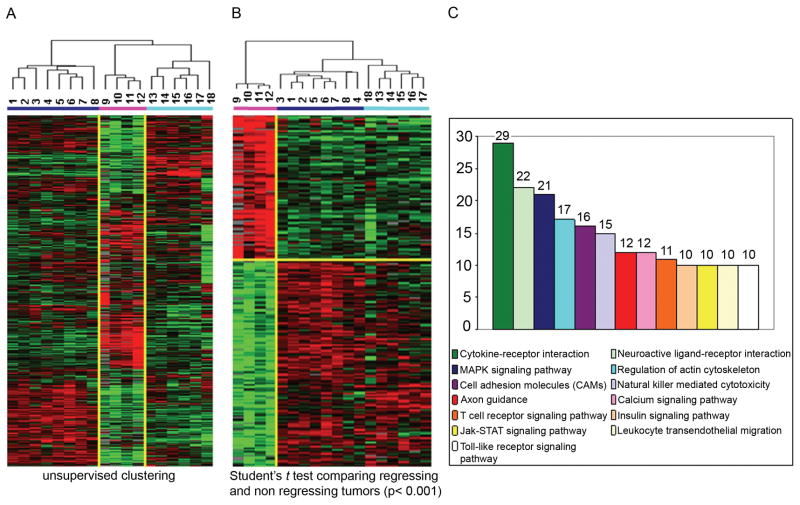
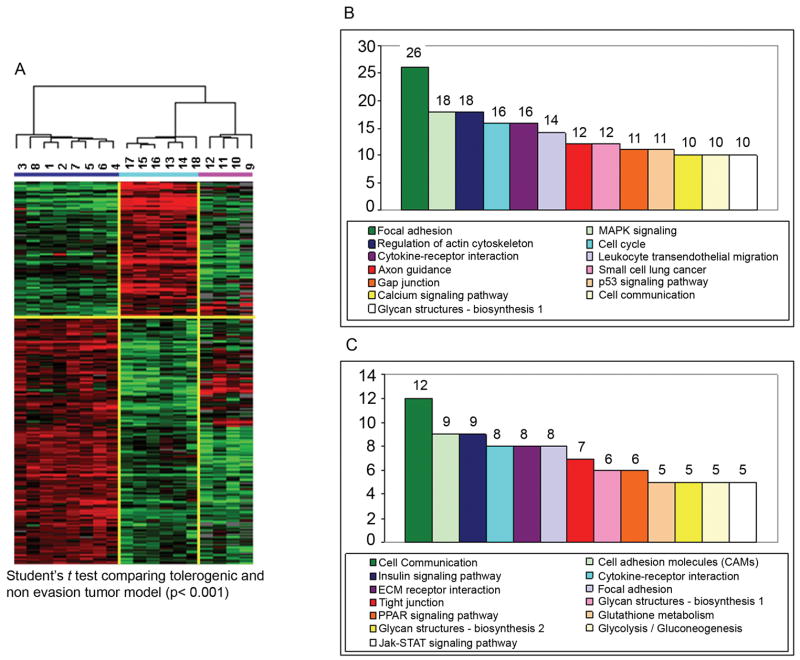
We have previously shown T-cell-mediated rejection of the neu-overexpressing mammary carcinoma cells (MMC) in wild-type FVB mice. However, following rejection of primary tumors, a fraction of animals experienced a recurrence of a neu antigen-negative variant (ANV) of MMC (tumor evasion model) after a long latency period. In the present study, we determined that T cells derived from wild-type FVB mice can specifically recognize MMC by secreting IFN-gamma and can induce apoptosis of MMC in vitro. Neu transgenic (FVBN202) mice develop spontaneous tumors and cannot reject it (tumor tolerance model). To dissect the mechanisms associated with rejection or tolerance of MMC tumors, we compared transcriptional patterns within the tumor microenvironment of MMC undergoing rejection with those that resisted it either because of tumor evasion/antigen loss recurrence (ANV tumors) or because of intrinsic tolerance mechanisms displayed by the transgenic mice. Gene profiling confirmed that immune rejection is primarily mediated through activation of IFN-stimulated genes and T-cell effector mechanisms. The tumor evasion model showed combined activation of Th1 and Th2 with a deviation toward Th2 and humoral immune responses that failed to achieve rejection likely because of lack of target antigen. Interestingly, the tumor tolerance model instead displayed immune suppression pathways through activation of regulatory mechanisms that included in particular the overexpression of interleukin-10 (IL-10), IL-10 receptor, and suppressor of cytokine signaling (SOCS)-1 and SOCS-3. These data provide a road map for the identification of novel biomarkers of immune responsiveness in clinical trials.
Figures
Similar articles
-
HER-2/neu antigen loss and relapse of mammary carcinoma are actively induced by T cell-mediated anti-tumor immune responses.Eur J Immunol. 2007 Mar;37(3):675-85. doi: 10.1002/eji.200636639. Eur J Immunol. 2007. PMID: 17304628 Free PMC article.
-
Spontaneous mammary carcinomas fail to induce an immune response in syngeneic FVBN202 neu transgenic mice.Int J Cancer. 2000 Sep 1;87(5):688-94. Int J Cancer. 2000. PMID: 10925363
-
The collaboration of both humoral and cellular HER-2/neu-targeted immune responses is required for the complete eradication of HER-2/neu-expressing tumors.Cancer Res. 2001 Feb 1;61(3):880-3. Cancer Res. 2001. PMID: 11221874
-
HER-2/neu is a tumor rejection target in tolerized HER-2/neu transgenic mice.Cancer Res. 2000 Jul 1;60(13):3569-76. Cancer Res. 2000. PMID: 10910070
-
Expansion of HER2/neu-specific T cells ex vivo following immunization with a HER2/neu peptide-based vaccine.Clin Breast Cancer. 2001 Apr;2(1):73-9. doi: 10.3816/CBC.2001.n.014. Clin Breast Cancer. 2001. PMID: 11899386 Review.
Cited by
-
Analysis of surrogate gene expression markers in peripheral blood of melanoma patients to predict treatment outcome of adjuvant pegylated interferon alpha 2b (EORTC 18991 side study).Cancer Immunol Immunother. 2013 Jul;62(7):1223-33. doi: 10.1007/s00262-013-1428-4. Epub 2013 Apr 27. Cancer Immunol Immunother. 2013. PMID: 23624802 Free PMC article. Clinical Trial.
-
Revisiting cancer immunoediting by understanding cancer immune complexity.J Pathol. 2011 May;224(1):5-9. doi: 10.1002/path.2865. J Pathol. 2011. PMID: 21480229 Free PMC article.
-
Enhanced tumor therapy using vaccinia virus strain GLV-1h68 in combination with a β-galactosidase-activatable prodrug seco-analog of duocarmycin SA.Cancer Gene Ther. 2011 Jan;18(1):42-52. doi: 10.1038/cgt.2010.49. Epub 2010 Sep 10. Cancer Gene Ther. 2011. PMID: 20829890 Free PMC article.
-
Does HER-2/neu antigen loss in metastatic breast tumors occur under immune pressure?Int J Cancer. 2008 Sep 15;123(6):1476-7; author reply 1478-9. doi: 10.1002/ijc.23663. Int J Cancer. 2008. PMID: 18566999 Free PMC article. No abstract available.
-
Comparison of adjuvant activity of N- and C-terminal domain of gp96 in a Her2-positive breast cancer model.Cell Stress Chaperones. 2011 Jul;16(4):449-57. doi: 10.1007/s12192-011-0258-6. Epub 2011 Feb 26. Cell Stress Chaperones. 2011. PMID: 21359667 Free PMC article.
References
-
- Marincola FM, Rivoltini L, Salgaller ML, Player M, Rosenberg SA. Differential anti-MART-1/MelanA CTL activity in peripheral blood of HLA-A2 melanoma patients in comparison to healthy donors: evidence for in vivo priming by tumor cells. J Immunother. 1996;19:266–77. - PubMed
-
- D’Souza S, Rimoldi D, Lienard D, Lejeune F, Cerottini JC, Romero P. Circulating Melan-A/Mart-1 specific cytolytic T lymphocyte precursors in HLA-A2+ melanoma patients have a memory phenotype. Int J Cancer. 1998;78:699–706. - PubMed
-
- Lee K-H, Wang E, Nielsen M-B, et al. Increased vaccine-specific T cell frequency after peptide-based vaccination correlates with increased susceptibility to in vitro stimulation but does not lead to tumor regression. J Immunol. 1999;163:6292–300. - PubMed
-
- Panelli MC, Riker A, Kammula US, et al. Expansion of Tumor-T cell pairs from Fine Needle Aspirates of Melanoma Metastases. J Immunol. 2000;164:495–504. - PubMed
Publication types
MeSH terms
Substances
Grants and funding
LinkOut - more resources
Full Text Sources
Molecular Biology Databases
Research Materials
Miscellaneous
